<< Chapter < Page Chapter >> Page >

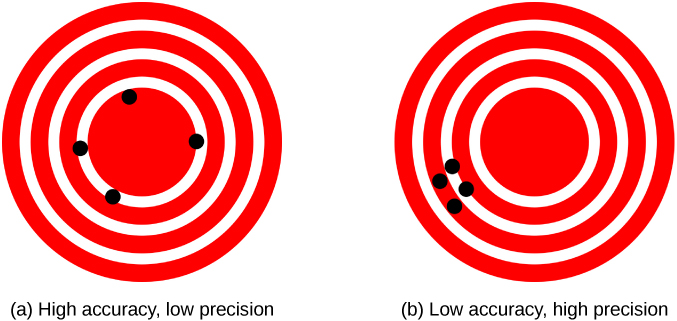
The measurements in the paper example are both accurate and precise, but in some cases, measurements are accurate but not precise, or they are precise but not accurate. Let’s consider an example of a GPS attempting to locate the position of a restaurant in a city. Think of the restaurant location as existing at the center of a bull’s-eye target and think of each GPS attempt to locate the restaurant as a black dot. In [link] (a), we see the GPS measurements are spread out far apart from each other, but they are all relatively close to the actual location of the restaurant at the center of the target. This indicates a low-precision, high-accuracy measuring system. However, in [link] (b), the GPS measurements are concentrated quite closely to one another, but they are far away from the target location. This indicates a high-precision, low-accuracy measuring system.

Two target patterns, each consisting of three white concentric rings on a red background. Figure a, labeled “High accuracy, low precision,” shows four black points, spread out along the circumference of the innermost circle. Figure b, labeled “Low accuracy, high precision,” shows four black points all clustered very near each other between the middle and outer circles.
A GPS attempts to locate a restaurant at the center of the bull’s-eye. The black dots represent each attempt to pinpoint the location of the restaurant. (a) The dots are spread out quite far apart from one another, indicating low precision, but they are each rather close to the actual location of the restaurant, indicating high accuracy. (b) The dots are concentrated rather closely to one another, indicating high precision, but they are rather far away from the actual location of the restaurant, indicating low accuracy. (credit a and credit b: modification of works by Dark Evil)

Accuracy, precision, uncertainty, and discrepancy

The precision of a measuring system is related to the uncertainty    in the measurements whereas the accuracy is related to the discrepancy    from the accepted reference value. Uncertainty is a quantitative measure of how much your measured values deviate from one another. There are many different methods of calculating uncertainty, each of which is appropriate to different situations. Some examples include taking the range (that is, the biggest less the smallest) or finding the standard deviation of the measurements. Discrepancy (or “measurement error”) is the difference between the measured value and a given standard or expected value. If the measurements are not very precise, then the uncertainty of the values is high. If the measurements are not very accurate, then the discrepancy of the values is high.

Recall our example of measuring paper length; we obtained measurements of 11.1 in., 11.2 in., and 10.9 in., and the accepted value was 11.0 in. We might average the three measurements to say our best guess is 11.1 in.; in this case, our discrepancy is 11.1 – 11.0 = 0.1 in., which provides a quantitative measure of accuracy. We might calculate the uncertainty in our best guess by using the range of our measured values: 0.3 in. Then we would say the length of the paper is 11.1 in. plus or minus 0.3 in. The uncertainty in a measurement, A , is often denoted as δA (read “delta A ”), so the measurement result would be recorded as A ± δA . Returning to our paper example, the measured length of the paper could be expressed as 11.1 ± 0.3 in. Since the discrepancy of 0.1 in. is less than the uncertainty of 0.3 in., we might say the measured value agrees with the accepted reference value to within experimental uncertainty.

Questions & Answers

What are the factors that affect demand for a commodity
Florence Reply
differentiate between demand and supply giving examples
Lambiv Reply
differentiated between demand and supply using examples
Lambiv
what is labour ?
Lambiv
how will I do?
Venny Reply
how is the graph works?I don't fully understand
Rezat Reply
information
Eliyee
devaluation
Eliyee
t
WARKISA
hi guys good evening to all
Lambiv
multiple choice question
Aster Reply
appreciation
Eliyee
explain perfect market
Lindiwe Reply
In economics, a perfect market refers to a theoretical construct where all participants have perfect information, goods are homogenous, there are no barriers to entry or exit, and prices are determined solely by supply and demand. It's an idealized model used for analysis,
Ezea
What is ceteris paribus?
Shukri Reply
other things being equal
AI-Robot
When MP₁ becomes negative, TP start to decline. Extuples Suppose that the short-run production function of certain cut-flower firm is given by: Q=4KL-0.6K2 - 0.112 • Where is quantity of cut flower produced, I is labour input and K is fixed capital input (K-5). Determine the average product of lab
Kelo
Extuples Suppose that the short-run production function of certain cut-flower firm is given by: Q=4KL-0.6K2 - 0.112 • Where is quantity of cut flower produced, I is labour input and K is fixed capital input (K-5). Determine the average product of labour (APL) and marginal product of labour (MPL)
Kelo
yes,thank you
Shukri
Can I ask you other question?
Shukri
what is monopoly mean?
Habtamu Reply
What is different between quantity demand and demand?
Shukri Reply
Quantity demanded refers to the specific amount of a good or service that consumers are willing and able to purchase at a give price and within a specific time period. Demand, on the other hand, is a broader concept that encompasses the entire relationship between price and quantity demanded
Ezea
ok
Shukri
how do you save a country economic situation when it's falling apart
Lilia Reply
what is the difference between economic growth and development
Fiker Reply
Economic growth as an increase in the production and consumption of goods and services within an economy.but Economic development as a broader concept that encompasses not only economic growth but also social & human well being.
Shukri
production function means
Jabir
What do you think is more important to focus on when considering inequality ?
Abdisa Reply
any question about economics?
Awais Reply
sir...I just want to ask one question... Define the term contract curve? if you are free please help me to find this answer 🙏
Asui
it is a curve that we get after connecting the pareto optimal combinations of two consumers after their mutually beneficial trade offs
Awais
thank you so much 👍 sir
Asui
In economics, the contract curve refers to the set of points in an Edgeworth box diagram where both parties involved in a trade cannot be made better off without making one of them worse off. It represents the Pareto efficient allocations of goods between two individuals or entities, where neither p
Cornelius
In economics, the contract curve refers to the set of points in an Edgeworth box diagram where both parties involved in a trade cannot be made better off without making one of them worse off. It represents the Pareto efficient allocations of goods between two individuals or entities,
Cornelius
Suppose a consumer consuming two commodities X and Y has The following utility function u=X0.4 Y0.6. If the price of the X and Y are 2 and 3 respectively and income Constraint is birr 50. A,Calculate quantities of x and y which maximize utility. B,Calculate value of Lagrange multiplier. C,Calculate quantities of X and Y consumed with a given price. D,alculate optimum level of output .
Feyisa Reply
Answer
Feyisa
c
Jabir
the market for lemon has 10 potential consumers, each having an individual demand curve p=101-10Qi, where p is price in dollar's per cup and Qi is the number of cups demanded per week by the i th consumer.Find the market demand curve using algebra. Draw an individual demand curve and the market dema
Gsbwnw Reply
suppose the production function is given by ( L, K)=L¼K¾.assuming capital is fixed find APL and MPL. consider the following short run production function:Q=6L²-0.4L³ a) find the value of L that maximizes output b)find the value of L that maximizes marginal product
Abdureman
Got questions? Join the online conversation and get instant answers!
Jobilize.com Reply
Practice Key Terms 7

Get Jobilize Job Search Mobile App in your pocket Now!

Get it on Google Play Download on the App Store Now


Source:  OpenStax, University physics volume 1. OpenStax CNX. Sep 19, 2016 Download for free at http://cnx.org/content/col12031/1.5
Google Play and the Google Play logo are trademarks of Google Inc.

Notification Switch

Would you like to follow the 'University physics volume 1' conversation and receive update notifications?

Ask