<< Chapter < Page Chapter >> Page >
A photograph shows a power-generating buoy in the sea. Figure shows the construction of the buoy. There is a float that rest on the surface of the water. From this, a rod like structure labeled spar goes down and is attached to a heavy plate. A cable connects the buoy to an undersea substation. Cables from other powerbuoys also come to the substation. A cable from the substation is marked cable to shore.
From the world of renewable energy sources comes the electric power-generating buoy. Although there are many versions, this one converts the up-and-down motion, as well as side-to-side motion, of the buoy into rotational motion in order to turn an electric generator, which stores the energy in batteries.

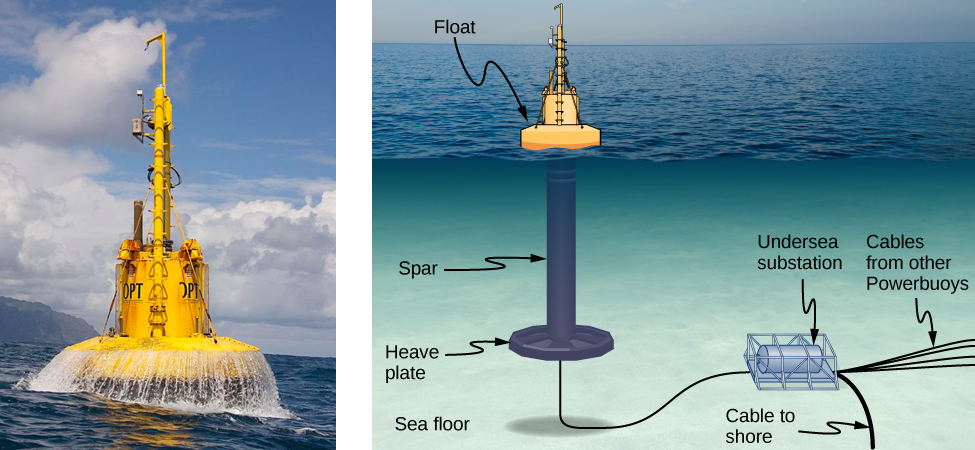
In this chapter, we study the physics of wave motion. We concentrate on mechanical waves, which are disturbances that move through a medium such as air or water. Like simple harmonic motion studied in the preceding chapter, the energy transferred through the medium is proportional to the amplitude squared. Surface water waves in the ocean are transverse waves in which the energy of the wave travels horizontally while the water oscillates up and down due to some restoring force. In the picture above, a buoy is used to convert the awesome power of ocean waves into electricity. The up-and-down motion of the buoy generated as the waves pass is converted into rotational motion that turns a rotor in an electric generator. The generator charges batteries, which are in turn used to provide a consistent energy source for the end user. This model was successfully tested by the US Navy in a project to provide power to coastal security networks and was able to provide an average power of 350 W. The buoy survived the difficult ocean environment, including operation off the New Jersey coast through Hurricane Irene in 2011.

The concepts presented in this chapter will be the foundation for many interesting topics, from the transmission of information to the concepts of quantum mechanics.

Questions & Answers

how do you get the 2/50
Abba Reply
number of sport play by 50 student construct discrete data
Aminu Reply
width of the frangebany leaves on how to write a introduction
Theresa Reply
Solve the mean of variance
Veronica Reply
Step 1: Find the mean. To find the mean, add up all the scores, then divide them by the number of scores. ... Step 2: Find each score's deviation from the mean. ... Step 3: Square each deviation from the mean. ... Step 4: Find the sum of squares. ... Step 5: Divide the sum of squares by n – 1 or N.
kenneth
what is error
Yakuba Reply
Is mistake done to something
Vutshila
Hy
anas
hy
What is the life teble
anas
hy
Jibrin
statistics is the analyzing of data
Tajudeen Reply
what is statics?
Zelalem Reply
how do you calculate mean
Gloria Reply
diveving the sum if all values
Shaynaynay
let A1,A2 and A3 events be independent,show that (A1)^c, (A2)^c and (A3)^c are independent?
Fisaye Reply
what is statistics
Akhisani Reply
data collected all over the world
Shaynaynay
construct a less than and more than table
Imad Reply
The sample of 16 students is taken. The average age in the sample was 22 years with astandard deviation of 6 years. Construct a 95% confidence interval for the age of the population.
Aschalew Reply
Bhartdarshan' is an internet-based travel agency wherein customer can see videos of the cities they plant to visit. The number of hits daily is a normally distributed random variable with a mean of 10,000 and a standard deviation of 2,400 a. what is the probability of getting more than 12,000 hits? b. what is the probability of getting fewer than 9,000 hits?
Akshay Reply
Bhartdarshan'is an internet-based travel agency wherein customer can see videos of the cities they plan to visit. The number of hits daily is a normally distributed random variable with a mean of 10,000 and a standard deviation of 2,400. a. What is the probability of getting more than 12,000 hits
Akshay
1
Bright
Sorry i want to learn more about this question
Bright
Someone help
Bright
a= 0.20233 b=0.3384
Sufiyan
a
Shaynaynay
How do I interpret level of significance?
Mohd Reply
It depends on your business problem or in Machine Learning you could use ROC- AUC cruve to decide the threshold value
Shivam
how skewness and kurtosis are used in statistics
Owen Reply
yes what is it
Taneeya
Got questions? Join the online conversation and get instant answers!
Jobilize.com Reply

Get Jobilize Job Search Mobile App in your pocket Now!

Get it on Google Play Download on the App Store Now


Source:  OpenStax, University physics volume 1. OpenStax CNX. Sep 19, 2016 Download for free at http://cnx.org/content/col12031/1.5
Google Play and the Google Play logo are trademarks of Google Inc.

Notification Switch

Would you like to follow the 'University physics volume 1' conversation and receive update notifications?

Ask