<< Chapter < Page Chapter >> Page >
By the end of this section, you will be able to:
  • Create and interpret graphs of potential energy
  • Explain the connection between stability and potential energy

Often, you can get a good deal of useful information about the dynamical behavior of a mechanical system just by interpreting a graph of its potential energy as a function of position, called a potential energy diagram    . This is most easily accomplished for a one-dimensional system, whose potential energy can be plotted in one two-dimensional graph—for example, U ( x ) versus x —on a piece of paper or a computer program. For systems whose motion is in more than one dimension, the motion needs to be studied in three-dimensional space. We will simplify our procedure for one-dimensional motion only.

First, let’s look at an object, freely falling vertically, near the surface of Earth, in the absence of air resistance. The mechanical energy of the object is conserved, E = K + U , and the potential energy, with respect to zero at ground level, is U ( y ) = m g y , which is a straight line through the origin with slope m g . In the graph shown in [link] , the x -axis is the height above the ground y and the y -axis is the object’s energy.

The energy, in units of Joules, is plotted as a function of height above the ground in meters. The graph of potential energy U is a straight red line through the origin, where y sub zero equals zero. The equation of the line is given as U of y equals m g y.  The graph of the total energy E which is equal to K plus U is a constant, which appears as a black horizontal line. The height above the ground where  the E and U graphs intersect is y sub max. The energy between the red U line and the horizontal axis us U sub A. The energy between the red U of y line and the black E line is K sub A.
The potential energy graph for an object in vertical free fall, with various quantities indicated.

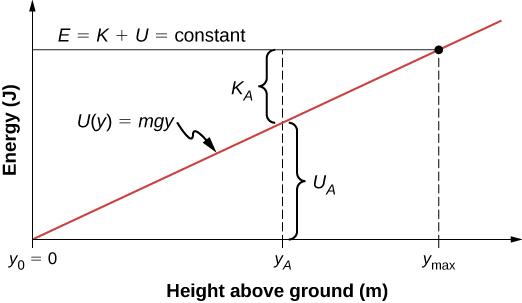
The line at energy E represents the constant mechanical energy of the object, whereas the kinetic and potential energies, K A and U A , are indicated at a particular height y A . You can see how the total energy is divided between kinetic and potential energy as the object’s height changes. Since kinetic energy can never be negative, there is a maximum potential energy and a maximum height, which an object with the given total energy cannot exceed:

K = E U 0 , U E .

If we use the gravitational potential energy reference point of zero at y 0 , we can rewrite the gravitational potential energy U as mgy . Solving for y results in

y E / m g = y max .

We note in this expression that the quantity of the total energy divided by the weight ( mg ) is located at the maximum height of the particle, or y max . At the maximum height, the kinetic energy and the speed are zero, so if the object were initially traveling upward, its velocity would go through zero there, and y max would be a turning point in the motion. At ground level, y 0 = 0 , the potential energy is zero, and the kinetic energy and the speed are maximum:

U 0 = 0 = E K 0 , E = K 0 = 1 2 m v 0 2 , v 0 = ± 2 E / m .

The maximum speed ± v 0 gives the initial velocity necessary to reach y max , the maximum height, and v 0 represents the final velocity, after falling from y max . You can read all this information, and more, from the potential energy diagram we have shown.

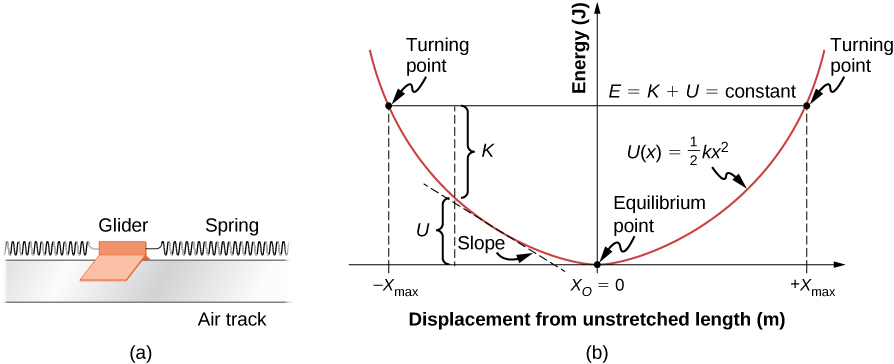
Consider a mass-spring system on a frictionless, stationary, horizontal surface, so that gravity and the normal contact force do no work and can be ignored ( [link] ). This is like a one-dimensional system, whose mechanical energy E is a constant and whose potential energy, with respect to zero energy at zero displacement from the spring’s unstretched length, x = 0 , is U ( x ) = 1 2 k x 2 .

Figure a is an illustration of a glider between springs on a horizontal air track. Figure b is a graph of energy in Joules as a function of displacement from unstretched length in meters. The potential energy U of x is plotted as a red upward opening parabola. The function U of x is equal to one half k x squared. The equilibrium point is at the minimum of the parabola, where x sub zero equals zero. The total energy E which is equal to K plus U and is constant is plotted as a horizontal black line. The points where the total E line meets the potential U curve are labeled as turning points. One turning point is at minus x sub max, and the other is at plus x sub max.
(a) A glider between springs on an air track is an example of a horizontal mass-spring system. (b) The potential energy diagram for this system, with various quantities indicated.

Questions & Answers

What are the factors that affect demand for a commodity
Florence Reply
differentiate between demand and supply giving examples
Lambiv Reply
differentiated between demand and supply using examples
Lambiv
what is labour ?
Lambiv
how will I do?
Venny Reply
how is the graph works?I don't fully understand
Rezat Reply
information
Eliyee
devaluation
Eliyee
t
WARKISA
hi guys good evening to all
Lambiv
multiple choice question
Aster Reply
appreciation
Eliyee
explain perfect market
Lindiwe Reply
In economics, a perfect market refers to a theoretical construct where all participants have perfect information, goods are homogenous, there are no barriers to entry or exit, and prices are determined solely by supply and demand. It's an idealized model used for analysis,
Ezea
What is ceteris paribus?
Shukri Reply
other things being equal
AI-Robot
When MP₁ becomes negative, TP start to decline. Extuples Suppose that the short-run production function of certain cut-flower firm is given by: Q=4KL-0.6K2 - 0.112 • Where is quantity of cut flower produced, I is labour input and K is fixed capital input (K-5). Determine the average product of lab
Kelo
Extuples Suppose that the short-run production function of certain cut-flower firm is given by: Q=4KL-0.6K2 - 0.112 • Where is quantity of cut flower produced, I is labour input and K is fixed capital input (K-5). Determine the average product of labour (APL) and marginal product of labour (MPL)
Kelo
yes,thank you
Shukri
Can I ask you other question?
Shukri
what is monopoly mean?
Habtamu Reply
What is different between quantity demand and demand?
Shukri Reply
Quantity demanded refers to the specific amount of a good or service that consumers are willing and able to purchase at a give price and within a specific time period. Demand, on the other hand, is a broader concept that encompasses the entire relationship between price and quantity demanded
Ezea
ok
Shukri
how do you save a country economic situation when it's falling apart
Lilia Reply
what is the difference between economic growth and development
Fiker Reply
Economic growth as an increase in the production and consumption of goods and services within an economy.but Economic development as a broader concept that encompasses not only economic growth but also social & human well being.
Shukri
production function means
Jabir
What do you think is more important to focus on when considering inequality ?
Abdisa Reply
any question about economics?
Awais Reply
sir...I just want to ask one question... Define the term contract curve? if you are free please help me to find this answer 🙏
Asui
it is a curve that we get after connecting the pareto optimal combinations of two consumers after their mutually beneficial trade offs
Awais
thank you so much 👍 sir
Asui
In economics, the contract curve refers to the set of points in an Edgeworth box diagram where both parties involved in a trade cannot be made better off without making one of them worse off. It represents the Pareto efficient allocations of goods between two individuals or entities, where neither p
Cornelius
In economics, the contract curve refers to the set of points in an Edgeworth box diagram where both parties involved in a trade cannot be made better off without making one of them worse off. It represents the Pareto efficient allocations of goods between two individuals or entities,
Cornelius
Suppose a consumer consuming two commodities X and Y has The following utility function u=X0.4 Y0.6. If the price of the X and Y are 2 and 3 respectively and income Constraint is birr 50. A,Calculate quantities of x and y which maximize utility. B,Calculate value of Lagrange multiplier. C,Calculate quantities of X and Y consumed with a given price. D,alculate optimum level of output .
Feyisa Reply
Answer
Feyisa
c
Jabir
the market for lemon has 10 potential consumers, each having an individual demand curve p=101-10Qi, where p is price in dollar's per cup and Qi is the number of cups demanded per week by the i th consumer.Find the market demand curve using algebra. Draw an individual demand curve and the market dema
Gsbwnw Reply
suppose the production function is given by ( L, K)=L¼K¾.assuming capital is fixed find APL and MPL. consider the following short run production function:Q=6L²-0.4L³ a) find the value of L that maximizes output b)find the value of L that maximizes marginal product
Abdureman
Got questions? Join the online conversation and get instant answers!
Jobilize.com Reply
Practice Key Terms 3

Get Jobilize Job Search Mobile App in your pocket Now!

Get it on Google Play Download on the App Store Now


Source:  OpenStax, University physics volume 1. OpenStax CNX. Sep 19, 2016 Download for free at http://cnx.org/content/col12031/1.5
Google Play and the Google Play logo are trademarks of Google Inc.

Notification Switch

Would you like to follow the 'University physics volume 1' conversation and receive update notifications?

Ask