<< Chapter < Page Chapter >> Page >
By the end of this section, you will be able to:
  • Determine the correct number of significant figures for the result of a computation.
  • Describe the relationship between the concepts of accuracy, precision, uncertainty, and discrepancy.
  • Calculate the percent uncertainty of a measurement, given its value and its uncertainty.
  • Determine the uncertainty of the result of a computation involving quantities with given uncertainties.

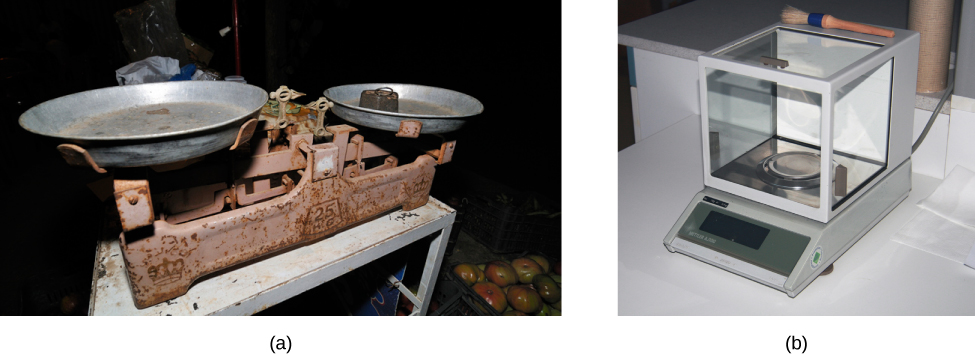
[link] shows two instruments used to measure the mass of an object. The digital scale has mostly replaced the double-pan balance in physics labs because it gives more accurate and precise measurements. But what exactly do we mean by accurate and precise ? Aren’t they the same thing? In this section we examine in detail the process of making and reporting a measurement.

Figure a shows an old rusted double-pan balance with a standard mass on one pan. Figure b shows a modern digital analytical balance.
(a) A double-pan mechanical balance is used to compare different masses. Usually an object with unknown mass is placed in one pan and objects of known mass are placed in the other pan. When the bar that connects the two pans is horizontal, then the masses in both pans are equal. The “known masses” are typically metal cylinders of standard mass such as 1 g, 10 g, and 100 g. (b) Many mechanical balances, such as double-pan balances, have been replaced by digital scales, which can typically measure the mass of an object more precisely. A mechanical balance may read only the mass of an object to the nearest tenth of a gram, but many digital scales can measure the mass of an object up to the nearest thousandth of a gram. (credit a: modification of work by Serge Melki; credit b: modification of work by Karel Jakubec)

Accuracy and precision of a measurement

Science is based on observation and experiment—that is, on measurements. Accuracy is how close a measurement is to the accepted reference value for that measurement. For example, let’s say we want to measure the length of standard printer paper. The packaging in which we purchased the paper states that it is 11.0 in. long. We then measure the length of the paper three times and obtain the following measurements: 11.1 in., 11.2 in., and 10.9 in. These measurements are quite accurate because they are very close to the reference value of 11.0 in. In contrast, if we had obtained a measurement of 12 in., our measurement would not be very accurate. Notice that the concept of accuracy    requires that an accepted reference value be given.

The precision    of measurements refers to how close the agreement is between repeated independent measurements (which are repeated under the same conditions). Consider the example of the paper measurements. The precision of the measurements refers to the spread of the measured values. One way to analyze the precision of the measurements is to determine the range, or difference, between the lowest and the highest measured values. In this case, the lowest value was 10.9 in. and the highest value was 11.2 in. Thus, the measured values deviated from each other by, at most, 0.3 in. These measurements were relatively precise because they did not vary too much in value. However, if the measured values had been 10.9 in., 11.1 in., and 11.9 in., then the measurements would not be very precise because there would be significant variation from one measurement to another. Notice that the concept of precision depends only on the actual measurements acquired and does not depend on an accepted reference value.

Questions & Answers

how do you get the 2/50
Abba Reply
number of sport play by 50 student construct discrete data
Aminu Reply
width of the frangebany leaves on how to write a introduction
Theresa Reply
Solve the mean of variance
Veronica Reply
Step 1: Find the mean. To find the mean, add up all the scores, then divide them by the number of scores. ... Step 2: Find each score's deviation from the mean. ... Step 3: Square each deviation from the mean. ... Step 4: Find the sum of squares. ... Step 5: Divide the sum of squares by n – 1 or N.
kenneth
what is error
Yakuba Reply
Is mistake done to something
Vutshila
Hy
anas
hy
What is the life teble
anas
hy
Jibrin
statistics is the analyzing of data
Tajudeen Reply
what is statics?
Zelalem Reply
how do you calculate mean
Gloria Reply
diveving the sum if all values
Shaynaynay
let A1,A2 and A3 events be independent,show that (A1)^c, (A2)^c and (A3)^c are independent?
Fisaye Reply
what is statistics
Akhisani Reply
data collected all over the world
Shaynaynay
construct a less than and more than table
Imad Reply
The sample of 16 students is taken. The average age in the sample was 22 years with astandard deviation of 6 years. Construct a 95% confidence interval for the age of the population.
Aschalew Reply
Bhartdarshan' is an internet-based travel agency wherein customer can see videos of the cities they plant to visit. The number of hits daily is a normally distributed random variable with a mean of 10,000 and a standard deviation of 2,400 a. what is the probability of getting more than 12,000 hits? b. what is the probability of getting fewer than 9,000 hits?
Akshay Reply
Bhartdarshan'is an internet-based travel agency wherein customer can see videos of the cities they plan to visit. The number of hits daily is a normally distributed random variable with a mean of 10,000 and a standard deviation of 2,400. a. What is the probability of getting more than 12,000 hits
Akshay
1
Bright
Sorry i want to learn more about this question
Bright
Someone help
Bright
a= 0.20233 b=0.3384
Sufiyan
a
Shaynaynay
How do I interpret level of significance?
Mohd Reply
It depends on your business problem or in Machine Learning you could use ROC- AUC cruve to decide the threshold value
Shivam
how skewness and kurtosis are used in statistics
Owen Reply
yes what is it
Taneeya
Got questions? Join the online conversation and get instant answers!
Jobilize.com Reply
Practice Key Terms 7

Get Jobilize Job Search Mobile App in your pocket Now!

Get it on Google Play Download on the App Store Now


Source:  OpenStax, University physics volume 1. OpenStax CNX. Sep 19, 2016 Download for free at http://cnx.org/content/col12031/1.5
Google Play and the Google Play logo are trademarks of Google Inc.

Notification Switch

Would you like to follow the 'University physics volume 1' conversation and receive update notifications?

Ask