<< Chapter < Page Chapter >> Page >
Photograph of an electric eel.
An electric eel flexes its muscles to create a voltage that stuns prey. (credit: chrisbb, Flickr)

Electrocardiograms

Just as nerve impulses are transmitted by depolarization and repolarization of adjacent membrane, the depolarization that causes muscle contraction can also stimulate adjacent muscle cells to depolarize (fire) and contract. Thus, a depolarization wave can be sent across the heart, coordinating its rhythmic contractions and enabling it to perform its vital function of propelling blood through the circulatory system. [link] is a simplified graphic of a depolarization wave spreading across the heart from the sinoarterial (SA) node , the heart’s natural pacemaker.
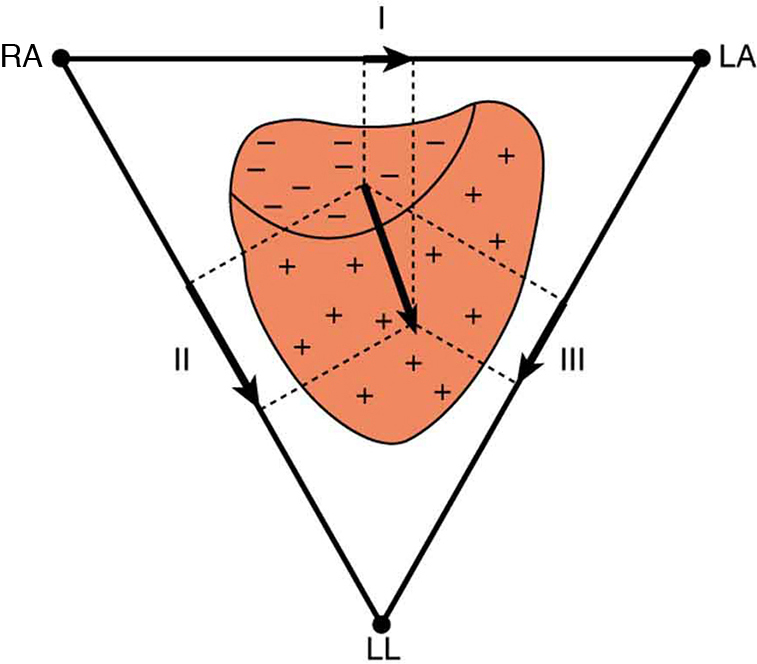
The figure shows that the charge distribution on the outer surface of the heart changes from positive to negative during depolarization. This wave of depolarization, spreading from the upper right toward the lower left of the heart, is represented by a vector pointing in the direction of the wave. The components of this vector are measured by placing electrodes on the patient’s chest. The figure shows three electrodes, labeled R A, L A, and L L, placed to form a triangle around the heart. The electrode R A is close to the right atrium, L A is close to the left atrium, and L L is just below the heart. R A and L A form a pair called lead one, R A and L L form a second pair called lead two, and L A and L L form a third pair called lead three. Each pair of electrodes measures a component of the depolarization vector.
The outer surface of the heart changes from positive to negative during depolarization. This wave of depolarization is spreading from the top of the heart and is represented by a vector pointing in the direction of the wave. This vector is a voltage (potential difference) vector. Three electrodes, labeled RA, LA, and LL, are placed on the patient. Each pair (called leads I, II, and III) measures a component of the depolarization vector and is graphed in an ECG.

An electrocardiogram (ECG)    is a record of the voltages created by the wave of depolarization and subsequent repolarization in the heart. Voltages between pairs of electrodes placed on the chest are vector components of the voltage wave on the heart. Standard ECGs have 12 or more electrodes, but only three are shown in [link] for clarity. Decades ago, three-electrode ECGs were performed by placing electrodes on the left and right arms and the left leg. The voltage between the right arm and the left leg is called the lead II potential and is the most often graphed. We shall examine the lead II potential as an indicator of heart-muscle function and see that it is coordinated with arterial blood pressure as well.

Heart function and its four-chamber action are explored in Viscosity and Laminar Flow; Poiseuille’s Law . Basically, the right and left atria receive blood from the body and lungs, respectively, and pump the blood into the ventricles. The right and left ventricles, in turn, pump blood through the lungs and the rest of the body, respectively. Depolarization of the heart muscle causes it to contract. After contraction it is repolarized to ready it for the next beat. The ECG measures components of depolarization and repolarization of the heart muscle and can yield significant information on the functioning and malfunctioning of the heart.

[link] shows an ECG of the lead II potential and a graph of the corresponding arterial blood pressure. The major features are labeled P, Q, R, S, and T. The P wave is generated by the depolarization and contraction of the atria as they pump blood into the ventricles. The QRS complex is created by the depolarization of the ventricles as they pump blood to the lungs and body. Since the shape of the heart and the path of the depolarization wave are not simple, the QRS complex has this typical shape and time span. The lead II QRS signal also masks the repolarization of the atria, which occur at the same time. Finally, the T wave is generated by the repolarization of the ventricles and is followed by the next P wave in the next heartbeat. Arterial blood pressure varies with each part of the heartbeat, with systolic (maximum) pressure occurring closely after the QRS complex, which signals contraction of the ventricles.

This figure has two graphs, placed one below the other. The lower graph shows an E C G of the lead two potential, and the upper graph shows the corresponding changes in arterial blood pressure. In each case, time is plotted on the horizontal axis, in seconds. The vertical axis of the upper graph shows the arterial blood pressure in millimeters of mercury, and the vertical axis of the lower graph shows the lead two voltage in millivolts. The upper graph is roughly sinusoidal, showing the diastolic or minimum blood pressure at about eighty millimeters of mercury, and the systolic or maximum blood pressure at about one hundred twenty millimeters of mercury. For the lower graph, the main features are labeled P, Q, R, S, and T. The P wave is a smooth curve that rises from zero millivolts to a peak of about zero point two five millivolts and falls to just below zero millivolts when it reaches point Q. From point Q to point R, the voltage rises steeply to about one millivolt, and then drops equally sharply to point S, at negative zero point three millivolts. This is followed by the T wave, which is a smooth curve, broader than the P wave, with a peak of comparable height. All of this is completed in less than seven-tenths of a second, with the voltage returning to zero millivolts. After about one-tenth of a second, the cycle begins again. The systolic blood pressure follows soon after the QRS complex.
A lead II ECG with corresponding arterial blood pressure. The QRS complex is created by the depolarization and contraction of the ventricles and is followed shortly by the maximum or systolic blood pressure. See text for further description.

Taken together, the 12 leads of a state-of-the-art ECG can yield a wealth of information about the heart. For example, regions of damaged heart tissue, called infarcts, reflect electrical waves and are apparent in one or more lead potentials. Subtle changes due to slight or gradual damage to the heart are most readily detected by comparing a recent ECG to an older one. This is particularly the case since individual heart shape, size, and orientation can cause variations in ECGs from one individual to another. ECG technology has advanced to the point where a portable ECG monitor with a liquid crystal instant display and a printer can be carried to patients' homes or used in emergency vehicles. See [link] .
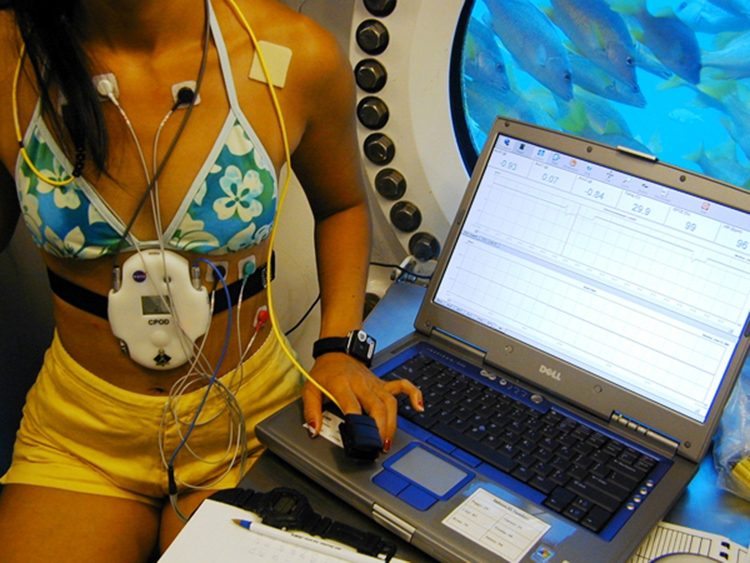
Photograph of a NASA scientist in an underwater habitat recording her vital signs using a portable device and a laptop computer.
This NASA scientist and NEEMO 5 aquanaut’s heart rate and other vital signs are being recorded by a portable device while living in an underwater habitat. (credit: NASA, Life Sciences Data Archive at Johnson Space Center, Houston, Texas)

Phet explorations: neuron

Neuron

Stimulate a neuron and monitor what happens. Pause, rewind, and move forward in time in order to observe the ions as they move across the neuron membrane.

Section summary

  • Electric potentials in neurons and other cells are created by ionic concentration differences across semipermeable membranes.
  • Stimuli change the permeability and create action potentials that propagate along neurons.
  • Myelin sheaths speed this process and reduce the needed energy input.
  • This process in the heart can be measured with an electrocardiogram (ECG).

Conceptual questions

Note that in [link] , both the concentration gradient and the Coulomb force tend to move Na + size 12{"Na" rSup { size 8{+{}} } } {} ions into the cell. What prevents this?

Got questions? Get instant answers now!

Define depolarization, repolarization, and the action potential.

Got questions? Get instant answers now!

Explain the properties of myelinated nerves in terms of the insulating properties of myelin.

Got questions? Get instant answers now!

Problems&Exercises

Integrated Concepts

Use the ECG in [link] to determine the heart rate in beats per minute assuming a constant time between beats.

80 beats/minute

Got questions? Get instant answers now!

Integrated Concepts

(a) Referring to [link] , find the time systolic pressure lags behind the middle of the QRS complex. (b) Discuss the reasons for the time lag.

Got questions? Get instant answers now!

Questions & Answers

Discuss the differences between taste and flavor, including how other sensory inputs contribute to our  perception of flavor.
John Reply
taste refers to your understanding of the flavor . while flavor one The other hand is refers to sort of just a blend things.
Faith
While taste primarily relies on our taste buds, flavor involves a complex interplay between taste and aroma
Kamara
which drugs can we use for ulcers
Ummi Reply
omeprazole
Kamara
what
Renee
what is this
Renee
is a drug
Kamara
of anti-ulcer
Kamara
Omeprazole Cimetidine / Tagament For the complicated once ulcer - kit
Patrick
what is the function of lymphatic system
Nency Reply
Not really sure
Eli
to drain extracellular fluid all over the body.
asegid
The lymphatic system plays several crucial roles in the human body, functioning as a key component of the immune system and contributing to the maintenance of fluid balance. Its main functions include: 1. Immune Response: The lymphatic system produces and transports lymphocytes, which are a type of
asegid
to transport fluids fats proteins and lymphocytes to the blood stream as lymph
Adama
what is anatomy
Oyindarmola Reply
Anatomy is the identification and description of the structures of living things
Kamara
what's the difference between anatomy and physiology
Oyerinde Reply
Anatomy is the study of the structure of the body, while physiology is the study of the function of the body. Anatomy looks at the body's organs and systems, while physiology looks at how those organs and systems work together to keep the body functioning.
AI-Robot
what is enzymes all about?
Mohammed Reply
Enzymes are proteins that help speed up chemical reactions in our bodies. Enzymes are essential for digestion, liver function and much more. Too much or too little of a certain enzyme can cause health problems
Kamara
yes
Prince
how does the stomach protect itself from the damaging effects of HCl
Wulku Reply
little girl okay how does the stomach protect itself from the damaging effect of HCL
Wulku
it is because of the enzyme that the stomach produce that help the stomach from the damaging effect of HCL
Kamara
function of digestive system
Ali Reply
function of digestive
Ali
the diagram of the lungs
Adaeze Reply
what is the normal body temperature
Diya Reply
37 degrees selcius
Xolo
37°c
Stephanie
please why 37 degree selcius normal temperature
Mark
36.5
Simon
37°c
Iyogho
the normal temperature is 37°c or 98.6 °Fahrenheit is important for maintaining the homeostasis in the body the body regular this temperature through the process called thermoregulation which involves brain skin muscle and other organ working together to maintain stable internal temperature
Stephanie
37A c
Wulku
what is anaemia
Diya Reply
anaemia is the decrease in RBC count hemoglobin count and PVC count
Eniola
what is the pH of the vagina
Diya Reply
how does Lysin attack pathogens
Diya
acid
Mary
I information on anatomy position and digestive system and there enzyme
Elisha Reply
anatomy of the female external genitalia
Muhammad Reply
Organ Systems Of The Human Body (Continued) Organ Systems Of The Human Body (Continued)
Theophilus Reply
what's lochia albra
Kizito
Got questions? Join the online conversation and get instant answers!
Jobilize.com Reply
Practice Key Terms 4

Get Jobilize Job Search Mobile App in your pocket Now!

Get it on Google Play Download on the App Store Now


Source:  OpenStax, College physics. OpenStax CNX. Jul 27, 2015 Download for free at http://legacy.cnx.org/content/col11406/1.9
Google Play and the Google Play logo are trademarks of Google Inc.

Notification Switch

Would you like to follow the 'College physics' conversation and receive update notifications?

Ask