<< Chapter < Page Chapter >> Page >
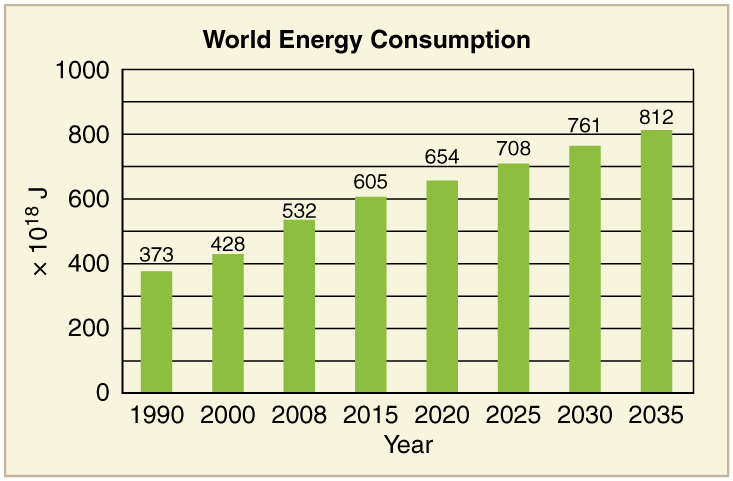
A bar graph depicting world energy consumption is shown. The year is listed on the horizontal axis and energy consumed is listed on the vertical axis. Energy consumption by the world is shown for different years. Energy consumption rises over time. In the year nineteen hundred and ninety it was three hundred seventy three multiplied by ten to the power eighteen joules, and the projection is that it will become eight hundred twelve multiplied by ten to the power eighteen joules by the year twenty thirty five.
Past and projected world energy use (source: Based on data from U.S. Energy Information Administration, 2011)
Solar cell arrays lined up in a field.
Solar cell arrays at a power plant in Steindorf, Germany (credit: Michael Betke, Flickr)

[link] displays the 2006 commercial energy mix by country for some of the prime energy users in the world. While non-renewable sources dominate, some countries get a sizeable percentage of their electricity from renewable resources. For example, about 67% of New Zealand’s electricity demand is met by hydroelectric. Only 10% of the U.S. electricity is generated by renewable resources, primarily hydroelectric. It is difficult to determine total contributions of renewable energy in some countries with a large rural population, so these percentages in this table are left blank.

Energy consumption—selected countries (2006)
Country Consumption, in EJ (10 18 J) Oil Natural Gas Coal Nuclear Hydro Other Renewables Electricity Use per capita (kWh/yr) Energy Use per capita (GJ/yr)
Australia 5.4 34% 17% 44% 0% 3% 1% 10000 260
Brazil 9.6 48% 7% 5% 1% 35% 2% 2000 50
China 63 22% 3% 69% 1% 6% 1500 35
Egypt 2.4 50% 41% 1% 0% 6% 990 32
Germany 16 37% 24% 24% 11% 1% 3% 6400 173
India 15 34% 7% 52% 1% 5% 470 13
Indonesia 4.9 51% 26% 16% 0% 2% 3% 420 22
Japan 24 48% 14% 21% 12% 4% 1% 7100 176
New Zealand 0.44 32% 26% 6% 0% 11% 19% 8500 102
Russia 31 19% 53% 16% 5% 6% 5700 202
U.S. 105 40% 23% 22% 8% 3% 1% 12500 340
World 432 39% 23% 24% 6% 6% 2% 2600 71

Energy and economic well-being

The last two columns in this table examine the energy and electricity use per capita. Economic well-being is dependent upon energy use, and in most countries higher standards of living, as measured by GDP (gross domestic product) per capita, are matched by higher levels of energy consumption per capita. This is borne out in [link] . Increased efficiency of energy use will change this dependency. A global problem is balancing energy resource development against the harmful effects upon the environment in its extraction and use.
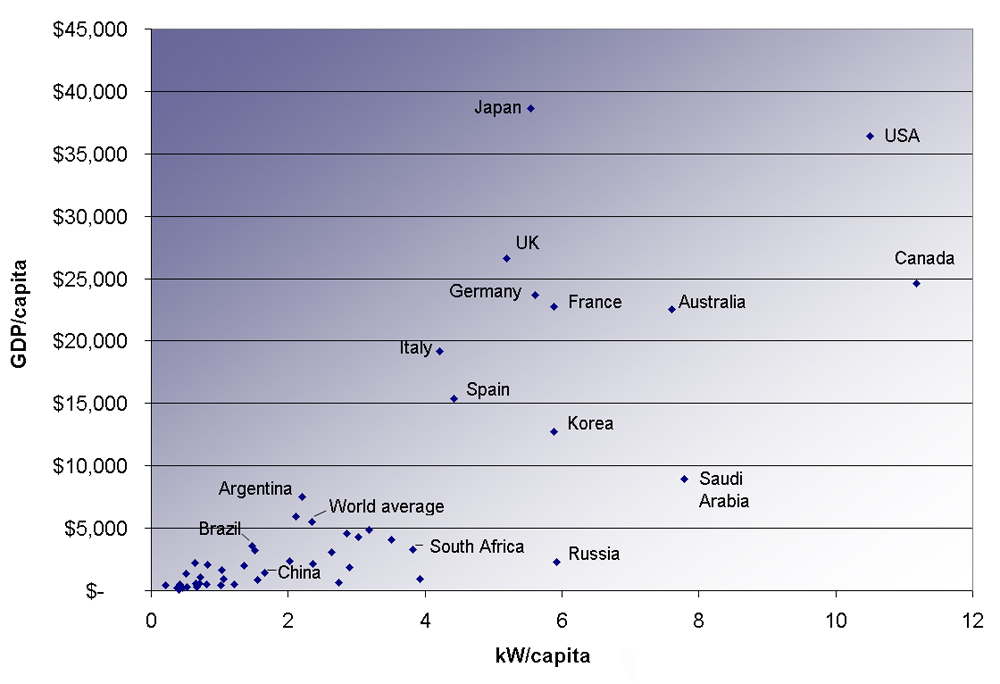
A scatter plot of power consumption per capita versus G D P per capita for various countries. Power consumption in kilowatt per capita is shown along the horizontal axis and G D P per capita is show along the vertical axis.
Power consumption per capita versus GDP per capita for various countries. Note the increase in energy usage with increasing GDP. (2007, credit: Frank van Mierlo, Wikimedia Commons)

Conserving energy

As we finish this chapter on energy and work, it is relevant to draw some distinctions between two sometimes misunderstood terms in the area of energy use. As has been mentioned elsewhere, the “law of the conservation of energy” is a very useful principle in analyzing physical processes. It is a statement that cannot be proven from basic principles, but is a very good bookkeeping device, and no exceptions have ever been found. It states that the total amount of energy in an isolated system will always remain constant. Related to this principle, but remarkably different from it, is the important philosophy of energy conservation. This concept has to do with seeking to decrease the amount of energy used by an individual or group through (1) reduced activities (e.g., turning down thermostats, driving fewer kilometers) and/or (2) increasing conversion efficiencies in the performance of a particular task—such as developing and using more efficient room heaters, cars that have greater miles-per-gallon ratings, energy-efficient compact fluorescent lights, etc.

Questions & Answers

Discuss the differences between taste and flavor, including how other sensory inputs contribute to our  perception of flavor.
John Reply
taste refers to your understanding of the flavor . while flavor one The other hand is refers to sort of just a blend things.
Faith
While taste primarily relies on our taste buds, flavor involves a complex interplay between taste and aroma
Kamara
which drugs can we use for ulcers
Ummi Reply
omeprazole
Kamara
what
Renee
what is this
Renee
is a drug
Kamara
of anti-ulcer
Kamara
Omeprazole Cimetidine / Tagament For the complicated once ulcer - kit
Patrick
what is the function of lymphatic system
Nency Reply
Not really sure
Eli
to drain extracellular fluid all over the body.
asegid
The lymphatic system plays several crucial roles in the human body, functioning as a key component of the immune system and contributing to the maintenance of fluid balance. Its main functions include: 1. Immune Response: The lymphatic system produces and transports lymphocytes, which are a type of
asegid
to transport fluids fats proteins and lymphocytes to the blood stream as lymph
Adama
what is anatomy
Oyindarmola Reply
Anatomy is the identification and description of the structures of living things
Kamara
what's the difference between anatomy and physiology
Oyerinde Reply
Anatomy is the study of the structure of the body, while physiology is the study of the function of the body. Anatomy looks at the body's organs and systems, while physiology looks at how those organs and systems work together to keep the body functioning.
AI-Robot
what is enzymes all about?
Mohammed Reply
Enzymes are proteins that help speed up chemical reactions in our bodies. Enzymes are essential for digestion, liver function and much more. Too much or too little of a certain enzyme can cause health problems
Kamara
yes
Prince
how does the stomach protect itself from the damaging effects of HCl
Wulku Reply
little girl okay how does the stomach protect itself from the damaging effect of HCL
Wulku
it is because of the enzyme that the stomach produce that help the stomach from the damaging effect of HCL
Kamara
function of digestive system
Ali Reply
function of digestive
Ali
the diagram of the lungs
Adaeze Reply
what is the normal body temperature
Diya Reply
37 degrees selcius
Xolo
37°c
Stephanie
please why 37 degree selcius normal temperature
Mark
36.5
Simon
37°c
Iyogho
the normal temperature is 37°c or 98.6 °Fahrenheit is important for maintaining the homeostasis in the body the body regular this temperature through the process called thermoregulation which involves brain skin muscle and other organ working together to maintain stable internal temperature
Stephanie
37A c
Wulku
what is anaemia
Diya Reply
anaemia is the decrease in RBC count hemoglobin count and PVC count
Eniola
what is the pH of the vagina
Diya Reply
how does Lysin attack pathogens
Diya
acid
Mary
I information on anatomy position and digestive system and there enzyme
Elisha Reply
anatomy of the female external genitalia
Muhammad Reply
Organ Systems Of The Human Body (Continued) Organ Systems Of The Human Body (Continued)
Theophilus Reply
what's lochia albra
Kizito
Got questions? Join the online conversation and get instant answers!
Jobilize.com Reply
Practice Key Terms 2

Get Jobilize Job Search Mobile App in your pocket Now!

Get it on Google Play Download on the App Store Now


Source:  OpenStax, College physics. OpenStax CNX. Jul 27, 2015 Download for free at http://legacy.cnx.org/content/col11406/1.9
Google Play and the Google Play logo are trademarks of Google Inc.

Notification Switch

Would you like to follow the 'College physics' conversation and receive update notifications?

Ask