

| << Chapter < Page | Chapter >> Page > |
[link] shows how viscosity is measured for a fluid. Two parallel plates have the specific fluid between them. The bottom plate is held fixed, while the top plate is moved to the right, dragging fluid with it. The layer (or lamina) of fluid in contact with either plate does not move relative to the plate, and so the top layer moves at while the bottom layer remains at rest. Each successive layer from the top down exerts a force on the one below it, trying to drag it along, producing a continuous variation in speed from to 0 as shown. Care is taken to insure that the flow is laminar; that is, the layers do not mix. The motion in [link] is like a continuous shearing motion. Fluids have zero shear strength, but the rate at which they are sheared is related to the same geometrical factors and as is shear deformation for solids.
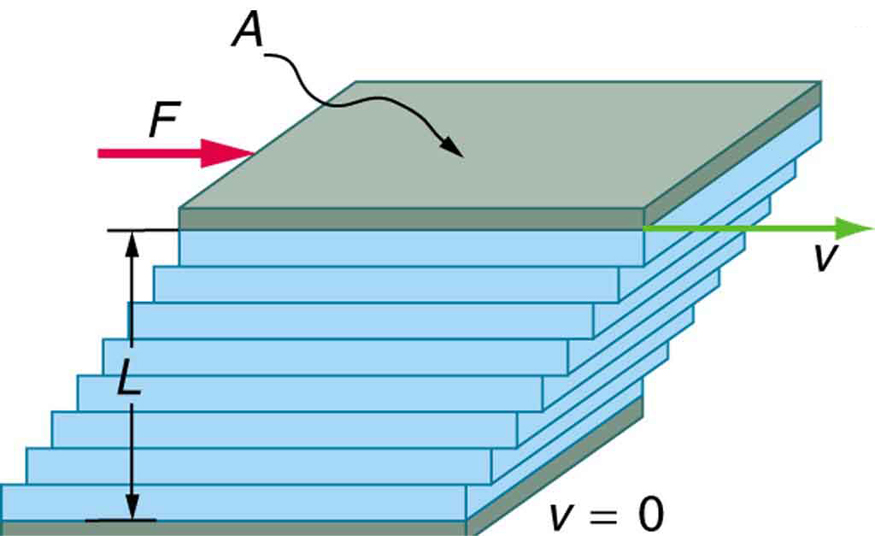
A force is required to keep the top plate in [link] moving at a constant velocity , and experiments have shown that this force depends on four factors. First, is directly proportional to (until the speed is so high that turbulence occurs—then a much larger force is needed, and it has a more complicated dependence on ). Second, is proportional to the area of the plate. This relationship seems reasonable, since is directly proportional to the amount of fluid being moved. Third, is inversely proportional to the distance between the plates . This relationship is also reasonable; is like a lever arm, and the greater the lever arm, the less force that is needed. Fourth, is directly proportional to the coefficient of viscosity , . The greater the viscosity, the greater the force required. These dependencies are combined into the equation
which gives us a working definition of fluid viscosity . Solving for gives
which defines viscosity in terms of how it is measured. The SI unit of viscosity is . [link] lists the coefficients of viscosity for various fluids.
Viscosity varies from one fluid to another by several orders of magnitude. As you might expect, the viscosities of gases are much less than those of liquids, and these viscosities are often temperature dependent. The viscosity of blood can be reduced by aspirin consumption, allowing it to flow more easily around the body. (When used over the long term in low doses, aspirin can help prevent heart attacks, and reduce the risk of blood clotting.)
What causes flow? The answer, not surprisingly, is pressure difference. In fact, there is a very simple relationship between horizontal flow and pressure. Flow rate is in the direction from high to low pressure. The greater the pressure differential between two points, the greater the flow rate. This relationship can be stated as
where and are the pressures at two points, such as at either end of a tube, and is the resistance to flow. The resistance includes everything, except pressure, that affects flow rate. For example, is greater for a long tube than for a short one. The greater the viscosity of a fluid, the greater the value of . Turbulence greatly increases , whereas increasing the diameter of a tube decreases .
Notification Switch
Would you like to follow the 'College physics' conversation and receive update notifications?

|
|
|
|
|

|
|

|
|

|
|

|
|

|
|

|
|

|
|

|
|

|
|

|