<< Chapter < Page Chapter >> Page >

PV size 12{ ital "PV"} {} diagrams clearly illustrate that the work done depends on the path taken and not just the endpoints . This path dependence is seen in 
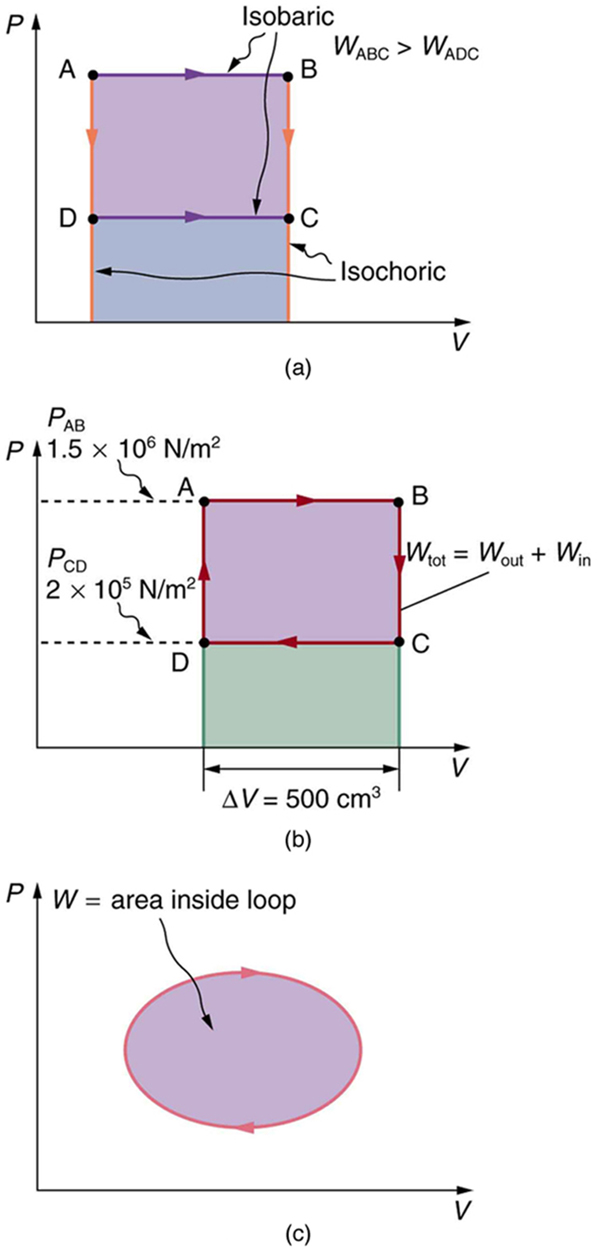
[link] (a), where more work is done in going from A to C by the path via point B than by the path via point D. The vertical paths, where volume is constant, are called isochoric processes. Since volume is constant, Δ V = 0 size 12{ΔV=0} {} , and no work is done in an isochoric process. Now, if the system follows the cyclical path ABCDA, as in [link] (b), then the total work done is the area inside the loop. The negative area below path CD subtracts, leaving only the area inside the rectangle. In fact, the work done in any cyclical process (one that returns to its starting point) is the area inside the loop it forms on a PV size 12{ ital "PV"} {} diagram, as [link] (c) illustrates for a general cyclical process. Note that the loop must be traversed in the clockwise direction for work to be positive—that is, for there to be a net work output.

Part a of the diagram shows a pressure versus volume graph. The pressure is along the Y axis and the volume is along the X axis. The curve has a rectangular shape. The curve is labeled A B C D. The paths A B and D C represent isobaric processes as shown by lines pointing toward the right, and A D and B C represent isochoric processes, as shown by lines pointing vertically downward. W sub A B C is shown greater than W sub A D C. The area below the curve A B C D, filling the rectangle A B C D, and the area immediately below path D C are also shaded. Part b of the diagram shows a pressure versus volume graph. The pressure is along the Y axis and the volume is along the X axis. The curve has a rectangular shape and is labeled A B C D. The paths A B and C D represent isobaric processes; A B is a line pointing to the right, and C D is a line pointing to the left. The paths B C and D A represent isochoric processes; B C points vertically downward, and D A points vertically upward. The length of the graph along A B is marked as delta V equals five hundred centimeters cubed. The line A B on the graph is shown to have a pressure P sub A B equals one point five multiplied by ten to the power six Newtons per meter square. The line D on the graph is shown to have a pressure P sub C D equals one point two multiplied by ten to the power five Newtons per meter squared. The total work is marked as W sub tot equals W sub out plus W sub in. Part c of the diagram shows a pressure versus volume graph. The pressure is along the Y axis and the volume is along the X axis. The graph is a closed loop in the form of an ellipse with the arrow pointing in clockwise direction. The shaded area inside the ellipse represents the work done.
(a) The work done in going from A to C depends on path. The work is greater for the path ABC than for the path ADC, because the former is at higher pressure. In both cases, the work done is the area under the path. This area is greater for path ABC. (b) The total work done in the cyclical process ABCDA is the area inside the loop, since the negative area below CD subtracts out, leaving just the area inside the rectangle. (The values given for the pressures and the change in volume are intended for use in the example below.) (c) The area inside any closed loop is the work done in the cyclical process. If the loop is traversed in a clockwise direction, W size 12{W} {} is positive—it is work done on the outside environment. If the loop is traveled in a counter-clockwise direction, W size 12{W} {} is negative—it is work that is done to the system.

Total work done in a cyclical process equals the area inside the closed loop on a PV Diagram

Calculate the total work done in the cyclical process ABCDA shown in [link] (b) by the following two methods to verify that work equals the area inside the closed loop on the PV size 12{ ital "PV"} {} diagram. (Take the data in the figure to be precise to three significant figures.) (a) Calculate the work done along each segment of the path and add these values to get the total work. (b) Calculate the area inside the rectangle ABCDA.

Strategy

To find the work along any path on a PV size 12{ ital "PV"} {} diagram, you use the fact that work is pressure times change in volume, or W = P Δ V size 12{W=PΔV} {} . So in part (a), this value is calculated for each leg of the path around the closed loop.

Solution for (a)

The work along path AB is

W AB = P AB Δ V AB = ( 1 . 50 × 10 6 N/m 2 ) ( 5 . 00 × 10 –4 m 3 ) = 750 J. alignl { stack { size 12{W rSub { size 8{"AB"} } =P rSub { size 8{"AB"} } DV rSub { size 8{"AB"} } } {} #= \( 1 "." "50"´"10" rSup { size 8{6} } " N/m" rSup { size 8{2} } \) \( 5 "." "00"´"10" rSup { size 8{4} } " m" rSup { size 8{3} } \) ="750"" J" "." {} } } {}

Since the path BC is isochoric, Δ V BC = 0 size 12{DV rSub { size 8{"BC"} } =0} {} , and so W BC = 0 size 12{W rSub { size 8{"BC"} } =0} {} . The work along path CD is negative, since Δ V CD size 12{DV rSub { size 8{"CD"} } } {} is negative (the volume decreases). The work is

W CD = P CD Δ V CD = ( 2 . 00 × 10 5 N/m 2 ) ( –5 . 00 × 10 –4 m 3 ) = 100 J . alignl { stack { size 12{W rSub { size 8{"CD"} } =P rSub { size 8{"CD"} } DV rSub { size 8{"CD"} } } {} #= \( 2 "." "00"´"10" rSup { size 8{5} } " N/m" rSup { size 8{2} } \) \( 5 "." "00"´"10" rSup { size 8{4} } " m" rSup { size 8{3} } \) "=-""100"" J" "." {} } } {}

Again, since the path DA is isochoric, Δ V DA = 0 size 12{DV rSub { size 8{"DA"} } =0} {} , and so W DA = 0 size 12{W rSub { size 8{"DA"} } =0} {} . Now the total work is

W = W AB + W BC + W CD + W DA = 750 J + 0 + ( 100 J ) + 0 = 650 J.

Solution for (b)

The area inside the rectangle is its height times its width, or

area = ( P AB P CD ) Δ V = ( 1.50 × 10 6 N/m 2 ) ( 2 . 00 × 10 5 N/m 2 ) ( 5 . 00 × 10 4 m 3 ) = 650 J. alignl { stack { size 12{"area"= \( P rSub { size 8{"AB"} } -P rSub { size 8{"CD"} } \) DV} {} #= left [ \( 1 "." "50"´"10" rSup { size 8{6} } " N/m" rSup { size 8{2} } \) - \( 2 "." "00"´"10" rSup { size 8{5} } " N/m" rSup { size 8{2} } \) right ]´ \( 5 "." "00"´"10" rSup { size 8{-4} } " m" rSup { size 8{3} } \) {} #="750"" J" "." {} } } {}

Questions & Answers

how do you get the 2/50
Abba Reply
number of sport play by 50 student construct discrete data
Aminu Reply
width of the frangebany leaves on how to write a introduction
Theresa Reply
Solve the mean of variance
Veronica Reply
Step 1: Find the mean. To find the mean, add up all the scores, then divide them by the number of scores. ... Step 2: Find each score's deviation from the mean. ... Step 3: Square each deviation from the mean. ... Step 4: Find the sum of squares. ... Step 5: Divide the sum of squares by n – 1 or N.
kenneth
what is error
Yakuba Reply
Is mistake done to something
Vutshila
Hy
anas
hy
What is the life teble
anas
hy
Jibrin
statistics is the analyzing of data
Tajudeen Reply
what is statics?
Zelalem Reply
how do you calculate mean
Gloria Reply
diveving the sum if all values
Shaynaynay
let A1,A2 and A3 events be independent,show that (A1)^c, (A2)^c and (A3)^c are independent?
Fisaye Reply
what is statistics
Akhisani Reply
data collected all over the world
Shaynaynay
construct a less than and more than table
Imad Reply
The sample of 16 students is taken. The average age in the sample was 22 years with astandard deviation of 6 years. Construct a 95% confidence interval for the age of the population.
Aschalew Reply
Bhartdarshan' is an internet-based travel agency wherein customer can see videos of the cities they plant to visit. The number of hits daily is a normally distributed random variable with a mean of 10,000 and a standard deviation of 2,400 a. what is the probability of getting more than 12,000 hits? b. what is the probability of getting fewer than 9,000 hits?
Akshay Reply
Bhartdarshan'is an internet-based travel agency wherein customer can see videos of the cities they plan to visit. The number of hits daily is a normally distributed random variable with a mean of 10,000 and a standard deviation of 2,400. a. What is the probability of getting more than 12,000 hits
Akshay
1
Bright
Sorry i want to learn more about this question
Bright
Someone help
Bright
a= 0.20233 b=0.3384
Sufiyan
a
Shaynaynay
How do I interpret level of significance?
Mohd Reply
It depends on your business problem or in Machine Learning you could use ROC- AUC cruve to decide the threshold value
Shivam
how skewness and kurtosis are used in statistics
Owen Reply
yes what is it
Taneeya
Got questions? Join the online conversation and get instant answers!
Jobilize.com Reply
Practice Key Terms 6

Get Jobilize Job Search Mobile App in your pocket Now!

Get it on Google Play Download on the App Store Now


Source:  OpenStax, College physics for ap® courses. OpenStax CNX. Nov 04, 2016 Download for free at https://legacy.cnx.org/content/col11844/1.14
Google Play and the Google Play logo are trademarks of Google Inc.

Notification Switch

Would you like to follow the 'College physics for ap® courses' conversation and receive update notifications?

Ask