<< Chapter < Page Chapter >> Page >

PV size 12{ ital "PV"} {} diagrams clearly illustrate that the work done depends on the path taken and not just the endpoints . This path dependence is seen in 
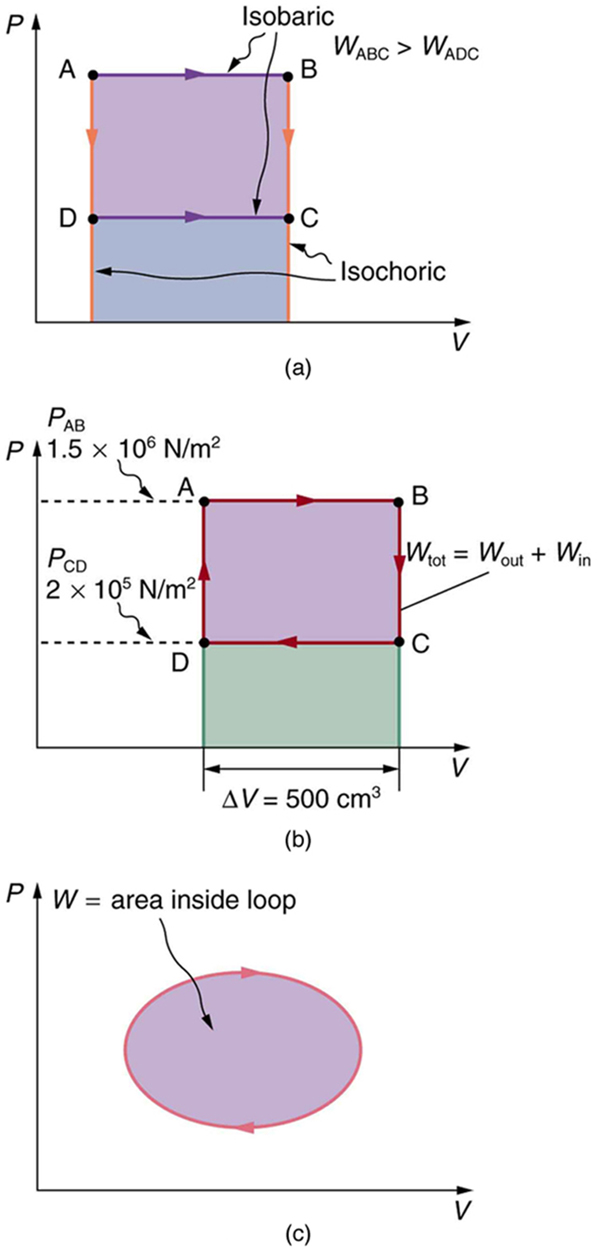
[link] (a), where more work is done in going from A to C by the path via point B than by the path via point D. The vertical paths, where volume is constant, are called isochoric processes. Since volume is constant, Δ V = 0 size 12{ΔV=0} {} , and no work is done in an isochoric process. Now, if the system follows the cyclical path ABCDA, as in [link] (b), then the total work done is the area inside the loop. The negative area below path CD subtracts, leaving only the area inside the rectangle. In fact, the work done in any cyclical process (one that returns to its starting point) is the area inside the loop it forms on a PV size 12{ ital "PV"} {} diagram, as [link] (c) illustrates for a general cyclical process. Note that the loop must be traversed in the clockwise direction for work to be positive—that is, for there to be a net work output.

Part a of the diagram shows a pressure versus volume graph. The pressure is along the Y axis and the volume is along the X axis. The curve has a rectangular shape. The curve is labeled A B C D. The paths A B and D C represent isobaric processes as shown by lines pointing toward the right, and A D and B C represent isochoric processes, as shown by lines pointing vertically downward. W sub A B C is shown greater than W sub A D C. The area below the curve A B C D, filling the rectangle A B C D, and the area immediately below path D C are also shaded. Part b of the diagram shows a pressure versus volume graph. The pressure is along the Y axis and the volume is along the X axis. The curve has a rectangular shape and is labeled A B C D. The paths A B and C D represent isobaric processes; A B is a line pointing to the right, and C D is a line pointing to the left. The paths B C and D A represent isochoric processes; B C points vertically downward, and D A points vertically upward. The length of the graph along A B is marked as delta V equals five hundred centimeters cubed. The line A B on the graph is shown to have a pressure P sub A B equals one point five multiplied by ten to the power six Newtons per meter square. The line D on the graph is shown to have a pressure P sub C D equals one point two multiplied by ten to the power five Newtons per meter squared. The total work is marked as W sub tot equals W sub out plus W sub in. Part c of the diagram shows a pressure versus volume graph. The pressure is along the Y axis and the volume is along the X axis. The graph is a closed loop in the form of an ellipse with the arrow pointing in clockwise direction. The shaded area inside the ellipse represents the work done.
(a) The work done in going from A to C depends on path. The work is greater for the path ABC than for the path ADC, because the former is at higher pressure. In both cases, the work done is the area under the path. This area is greater for path ABC. (b) The total work done in the cyclical process ABCDA is the area inside the loop, since the negative area below CD subtracts out, leaving just the area inside the rectangle. (The values given for the pressures and the change in volume are intended for use in the example below.) (c) The area inside any closed loop is the work done in the cyclical process. If the loop is traversed in a clockwise direction, W size 12{W} {} is positive—it is work done on the outside environment. If the loop is traveled in a counter-clockwise direction, W size 12{W} {} is negative—it is work that is done to the system.

Total work done in a cyclical process equals the area inside the closed loop on a PV Diagram

Calculate the total work done in the cyclical process ABCDA shown in [link] (b) by the following two methods to verify that work equals the area inside the closed loop on the PV size 12{ ital "PV"} {} diagram. (Take the data in the figure to be precise to three significant figures.) (a) Calculate the work done along each segment of the path and add these values to get the total work. (b) Calculate the area inside the rectangle ABCDA.

Strategy

To find the work along any path on a PV size 12{ ital "PV"} {} diagram, you use the fact that work is pressure times change in volume, or W = P Δ V size 12{W=PΔV} {} . So in part (a), this value is calculated for each leg of the path around the closed loop.

Solution for (a)

The work along path AB is

W AB = P AB Δ V AB = ( 1 . 50 × 10 6 N/m 2 ) ( 5 . 00 × 10 –4 m 3 ) = 750 J. alignl { stack { size 12{W rSub { size 8{"AB"} } =P rSub { size 8{"AB"} } DV rSub { size 8{"AB"} } } {} #= \( 1 "." "50"´"10" rSup { size 8{6} } " N/m" rSup { size 8{2} } \) \( 5 "." "00"´"10" rSup { size 8{4} } " m" rSup { size 8{3} } \) ="750"" J" "." {} } } {}

Since the path BC is isochoric, Δ V BC = 0 size 12{DV rSub { size 8{"BC"} } =0} {} , and so W BC = 0 size 12{W rSub { size 8{"BC"} } =0} {} . The work along path CD is negative, since Δ V CD size 12{DV rSub { size 8{"CD"} } } {} is negative (the volume decreases). The work is

W CD = P CD Δ V CD = ( 2 . 00 × 10 5 N/m 2 ) ( –5 . 00 × 10 –4 m 3 ) = 100 J . alignl { stack { size 12{W rSub { size 8{"CD"} } =P rSub { size 8{"CD"} } DV rSub { size 8{"CD"} } } {} #= \( 2 "." "00"´"10" rSup { size 8{5} } " N/m" rSup { size 8{2} } \) \( 5 "." "00"´"10" rSup { size 8{4} } " m" rSup { size 8{3} } \) "=-""100"" J" "." {} } } {}

Again, since the path DA is isochoric, Δ V DA = 0 size 12{DV rSub { size 8{"DA"} } =0} {} , and so W DA = 0 size 12{W rSub { size 8{"DA"} } =0} {} . Now the total work is

W = W AB + W BC + W CD + W DA = 750 J + 0 + ( 100 J ) + 0 = 650 J.

Solution for (b)

The area inside the rectangle is its height times its width, or

area = ( P AB P CD ) Δ V = ( 1.50 × 10 6 N/m 2 ) ( 2 . 00 × 10 5 N/m 2 ) ( 5 . 00 × 10 4 m 3 ) = 650 J. alignl { stack { size 12{"area"= \( P rSub { size 8{"AB"} } -P rSub { size 8{"CD"} } \) DV} {} #= left [ \( 1 "." "50"´"10" rSup { size 8{6} } " N/m" rSup { size 8{2} } \) - \( 2 "." "00"´"10" rSup { size 8{5} } " N/m" rSup { size 8{2} } \) right ]´ \( 5 "." "00"´"10" rSup { size 8{-4} } " m" rSup { size 8{3} } \) {} #="750"" J" "." {} } } {}

Questions & Answers

what is phylogeny
Odigie Reply
evolutionary history and relationship of an organism or group of organisms
AI-Robot
ok
Deng
what is biology
Hajah Reply
the study of living organisms and their interactions with one another and their environments
AI-Robot
what is biology
Victoria Reply
HOW CAN MAN ORGAN FUNCTION
Alfred Reply
the diagram of the digestive system
Assiatu Reply
allimentary cannel
Ogenrwot
How does twins formed
William Reply
They formed in two ways first when one sperm and one egg are splited by mitosis or two sperm and two eggs join together
Oluwatobi
what is genetics
Josephine Reply
Genetics is the study of heredity
Misack
how does twins formed?
Misack
What is manual
Hassan Reply
discuss biological phenomenon and provide pieces of evidence to show that it was responsible for the formation of eukaryotic organelles
Joseph Reply
what is biology
Yousuf Reply
the study of living organisms and their interactions with one another and their environment.
Wine
discuss the biological phenomenon and provide pieces of evidence to show that it was responsible for the formation of eukaryotic organelles in an essay form
Joseph Reply
what is the blood cells
Shaker Reply
list any five characteristics of the blood cells
Shaker
lack electricity and its more savely than electronic microscope because its naturally by using of light
Abdullahi Reply
advantage of electronic microscope is easily and clearly while disadvantage is dangerous because its electronic. advantage of light microscope is savely and naturally by sun while disadvantage is not easily,means its not sharp and not clear
Abdullahi
cell theory state that every organisms composed of one or more cell,cell is the basic unit of life
Abdullahi
is like gone fail us
DENG
cells is the basic structure and functions of all living things
Ramadan
What is classification
ISCONT Reply
is organisms that are similar into groups called tara
Yamosa
in what situation (s) would be the use of a scanning electron microscope be ideal and why?
Kenna Reply
A scanning electron microscope (SEM) is ideal for situations requiring high-resolution imaging of surfaces. It is commonly used in materials science, biology, and geology to examine the topography and composition of samples at a nanoscale level. SEM is particularly useful for studying fine details,
Hilary
Got questions? Join the online conversation and get instant answers!
Jobilize.com Reply
Practice Key Terms 6

Get Jobilize Job Search Mobile App in your pocket Now!

Get it on Google Play Download on the App Store Now


Source:  OpenStax, College physics for ap® courses. OpenStax CNX. Nov 04, 2016 Download for free at https://legacy.cnx.org/content/col11844/1.14
Google Play and the Google Play logo are trademarks of Google Inc.

Notification Switch

Would you like to follow the 'College physics for ap® courses' conversation and receive update notifications?

Ask