diagrams clearly illustrate that
the work done depends on the path taken and not just the endpoints . This path dependence is seen in
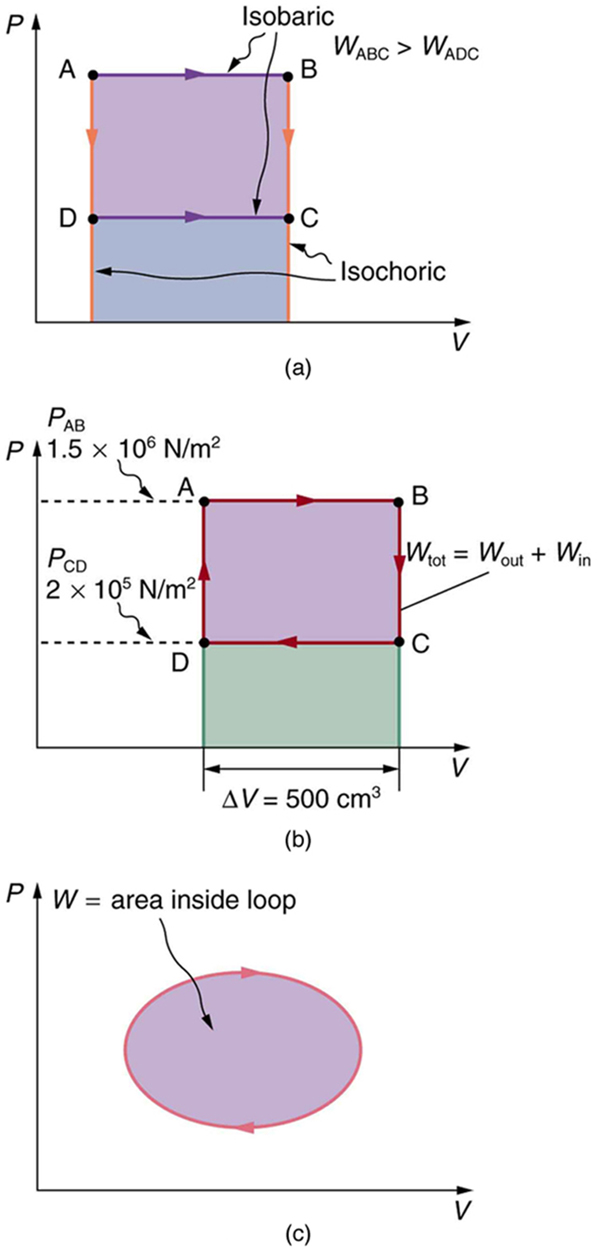
[link] (a), where more work is done in going from A to C by the path via point B than by the path via point D. The vertical paths, where volume is constant, are called
isochoric processes. Since volume is constant,
, and no work is done in an isochoric process. Now, if the system follows the cyclical path ABCDA, as in
[link] (b), then the total work done is the area inside the loop. The negative area below path CD subtracts, leaving only the area inside the rectangle. In fact, the work done in any cyclical process (one that returns to its starting point) is the area inside the loop it forms on a
diagram, as
[link] (c) illustrates for a general cyclical process. Note that the loop must be traversed in the clockwise direction for work to be positive—that is, for there to be a net work output.
(a) The work done in going from A to C depends on path. The work is greater for the path ABC than for the path ADC, because the former is at higher pressure. In both cases, the work done is the area under the path. This area is greater for path ABC. (b) The total work done in the cyclical process ABCDA is the area inside the loop, since the negative area below CD subtracts out, leaving just the area inside the rectangle. (The values given for the pressures and the change in volume are intended for use in the example below.) (c) The area inside any closed loop is the work done in the cyclical process. If the loop is traversed in a clockwise direction,
is positive—it is work done on the outside environment. If the loop is traveled in a counter-clockwise direction,
is negative—it is work that is done to the system.
Total work done in a cyclical process equals the area inside the closed loop on a
PV Diagram
Calculate the total work done in the cyclical process ABCDA shown in
[link] (b) by the following two methods to verify that work equals the area inside the closed loop on the
diagram. (Take the data in the figure to be precise to three significant figures.) (a) Calculate the work done along each segment of the path and add these values to get the total work. (b) Calculate the area inside the rectangle ABCDA.
Strategy
To find the work along any path on a
diagram, you use the fact that work is pressure times change in volume, or
. So in part (a), this value is calculated for each leg of the path around the closed loop.
Solution for (a)
The work along path AB is
Since the path BC is isochoric,
, and so
. The work along path CD is negative, since
is negative (the volume decreases). The work is
Again, since the path DA is isochoric,
, and so
. Now the total work is
Solution for (b)
The area inside the rectangle is its height times its width, or
Questions & Answers
A golfer on a fairway is 70 m away from the green, which sits below the level of the fairway by 20 m. If the golfer hits the ball at an angle of 40° with an initial speed of 20 m/s, how close to the green does she come?
A mouse of mass 200 g falls 100 m down a vertical mine shaft and lands at the bottom with a speed of 8.0 m/s. During its fall, how much work is done on the mouse by air resistance
Chemistry is a branch of science that deals with the study of matter,it composition,it structure and the changes it undergoes
Adjei
please, I'm a physics student and I need help in physics
Adjanou
chemistry could also be understood like the sexual attraction/repulsion of the male and female elements. the reaction varies depending on the energy differences of each given gender. + masculine -female.
Pedro
A ball is thrown straight up.it passes a 2.0m high window 7.50 m off the ground on it path up and takes 1.30 s to go past the window.what was the ball initial velocity
2. A sled plus passenger with total mass 50 kg is pulled 20 m across the snow (0.20) at constant velocity by a force directed 25° above the horizontal. Calculate (a) the work of the applied force, (b) the work of friction, and (c) the total work.
you have been hired as an espert witness in a court case involving an automobile accident. the accident involved car A of mass 1500kg which crashed into stationary car B of mass 1100kg. the driver of car A applied his brakes 15 m before he skidded and crashed into car B. after the collision, car A s
can someone explain to me, an ignorant high school student, why the trend of the graph doesn't follow the fact that the higher frequency a sound wave is, the more power it is, hence, making me think the phons output would follow this general trend?
Nevermind i just realied that the graph is the phons output for a person with normal hearing and not just the phons output of the sound waves power, I should read the entire thing next time
Joseph
Follow up question, does anyone know where I can find a graph that accuretly depicts the actual relative "power" output of sound over its frequency instead of just humans hearing
Joseph
"Generation of electrical energy from sound energy | IEEE Conference Publication | IEEE Xplore" ***ieeexplore.ieee.org/document/7150687?reload=true
A string is 3.00 m long with a mass of 5.00 g. The string is held taut with a tension of 500.00 N applied to the string. A pulse is sent down the string. How long does it take the pulse to travel the 3.00 m of the string?