<< Chapter < Page Chapter >> Page >

Why does Earth not remain stationary as the Moon orbits it? This is because, as expected from Newton's third law, if Earth exerts a force on the Moon, then the Moon should exert an equal and opposite force on Earth (see [link] ). We do not sense the Moon's effect on Earth's motion, because the Moon's gravity moves our bodies right along with Earth but there are other signs on Earth that clearly show the effect of the Moon's gravitational force as discussed in Satellites and Kepler's Laws: An Argument for Simplicity .
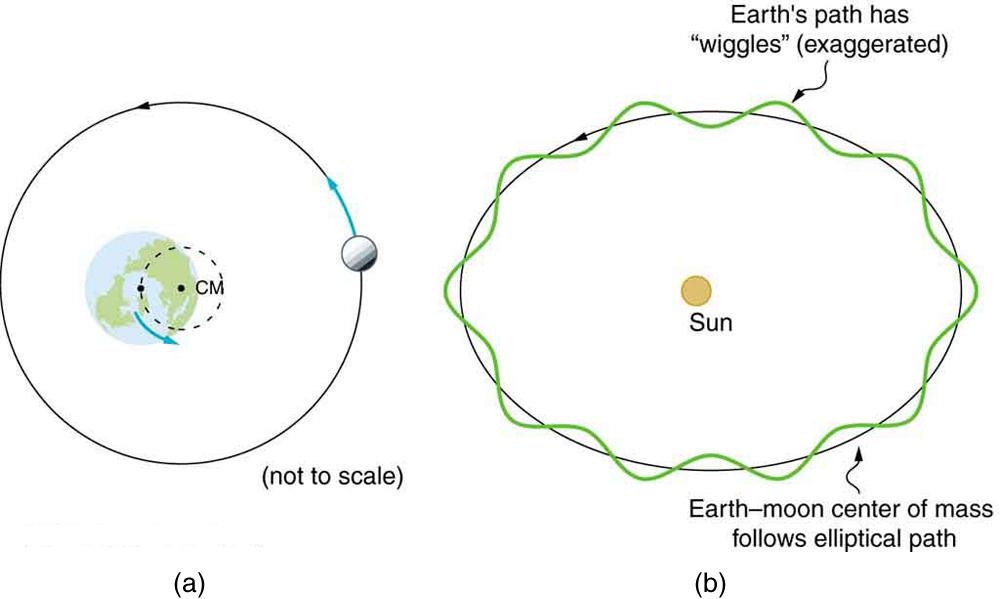
Figure a shows the Earth and the Moon around it orbiting in a circular path shown here as a circle around the Earth with an arrow over it showing the counterclockwise direction of the Moon. The center of mass of the circle is shown here with a point on the Earth that is not the Earth's center but just right to its center. Figure b shows the Sun and the counterclockwise rotation of the Earth around it, in an elliptical path, which has wiggles. Along this path the center of mass of the Earth-Moon is also shown; it follows non-wiggled elliptical path.
(a) Earth and the Moon rotate approximately once a month around their common center of mass. (b) Their center of mass orbits the Sun in an elliptical orbit, but Earth's path around the Sun has “wiggles” in it. Similar wiggles in the paths of stars have been observed and are considered direct evidence of planets orbiting those stars. This is important because the planets' reflected light is often too dim to be observed.

Tides

Ocean tides are one very observable result of the Moon's gravity acting on Earth. [link] is a simplified drawing of the Moon's position relative to the tides. Because water easily flows on Earth's surface, a high tide is created on the side of Earth nearest to the Moon, where the Moon's gravitational pull is strongest. Why is there also a high tide on the opposite side of Earth? The answer is that Earth is pulled toward the Moon more than the water on the far side, because Earth is closer to the Moon. So the water on the side of Earth closest to the Moon is pulled away from Earth, and Earth is pulled away from water on the far side. As Earth rotates, the tidal bulge (an effect of the tidal forces between an orbiting natural satellite and the primary planet that it orbits) keeps its orientation with the Moon. Thus there are two tides per day (the actual tidal period is about 12 hours and 25.2 minutes), because the Moon moves in its orbit each day as well).
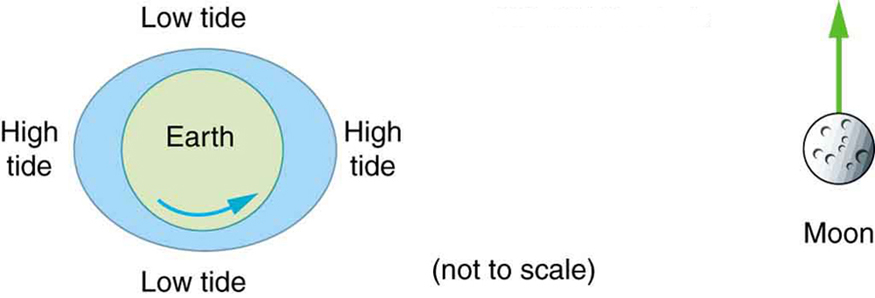
The given figure shows an ellipse, inside which there is a circular image of the Earth. There is a curved arrow in the lower part of the Earth's image pointing in the counterclockwise direction. The right and left side of the ellipse are labeled as High tide and the top and bottom side are labeled as Low tide. Alongside this image a circular image of the Moon is also given with dots showing the crates over it. A vertically upwards vector from its top is also shown, which indicates the direction of the Moon's velocity.
The Moon causes ocean tides by attracting the water on the near side more than Earth, and by attracting Earth more than the water on the far side. The distances and sizes are not to scale. For this simplified representation of the Earth-Moon system, there are two high and two low tides per day at any location, because Earth rotates under the tidal bulge.

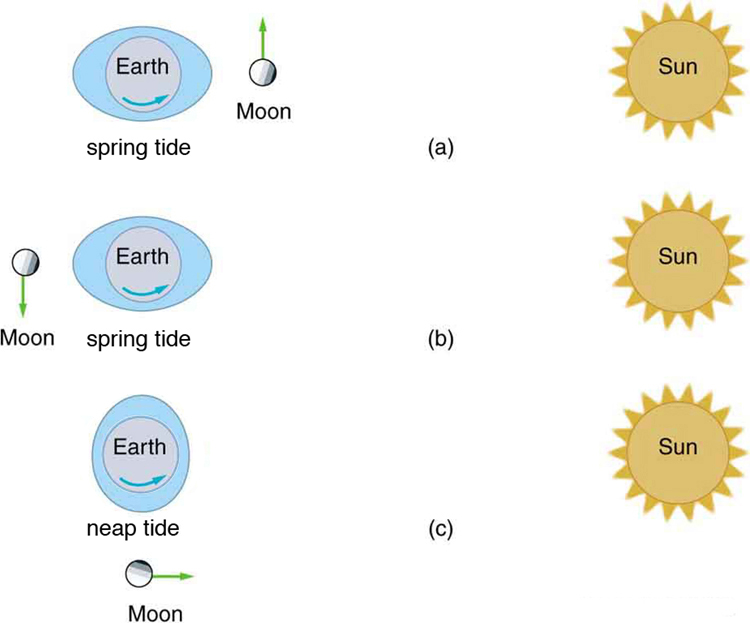
The Sun also affects tides, although it has about half the effect of the Moon. However, the largest tides, called spring tides, occur when Earth, the Moon, and the Sun are aligned. The smallest tides, called neap tides, occur when the Sun is at a 90º size 12{"90" rSup { size 8{ circ } } } {} angle to the Earth-Moon alignment.

Figure a shows an ellipse, inside which there is a circular image of the Earth. There is a curved arrow in the lower part of the Earth's image pointing in the counterclockwise direction. Alongside this image a circular image of the Moon is also given with dots showing the crates over it. A vertically upward vector from its top is also drawn, which shows the direction of velocity. To the right side of the image, an image of the Sun is also shown, in a circular shape with pointed wiggles throughout its boundary. Figure b shows an ellipse, inside which there is a circular image of the Earth. There is a curved arrow in the lower part of the Earth's image pointing in the counterclockwise direction. Alongside this image a circular image of the Moon is also given with dots showing the crates over it. A vertical downward vector from its bottom is also drawn, which shows the direction of velocity. To the right side of the image, an image of the Sun is also shown, in a circular shape and pointed wiggles throughout its boundary. Figure c shows an ellipse, inside which there is a circular image of the Earth. There is a curved arrow in the lower part of the Earth's image pointing in the counterclockwise direction. Alongside this image a circular image of the Moon is also given with dots showing the crates over it. A horizontal rightward vector from its right side is also drawn, which shows the direction of velocity. To the right side of the image, an image of the Sun is also shown, in a circular shape and pointed wiggles throughout its boundary.
(a, b) Spring tides: The highest tides occur when Earth, the Moon, and the Sun are aligned. (c) Neap tide: The lowest tides occur when the Sun lies at 90º size 12{"90" rSup { size 8{ circ } } } {} to the Earth-Moon alignment. Note that this figure is not drawn to scale.

Tides are not unique to Earth but occur in many astronomical systems. The most extreme tides occur where the gravitational force is the strongest and varies most rapidly, such as near black holes (see [link] ). A few likely candidates for black holes have been observed in our galaxy. These have masses greater than the Sun but have diameters only a few kilometers across. The tidal forces near them are so great that they can actually tear matter from a companion star.

Questions & Answers

how do you get the 2/50
Abba Reply
number of sport play by 50 student construct discrete data
Aminu Reply
width of the frangebany leaves on how to write a introduction
Theresa Reply
Solve the mean of variance
Veronica Reply
Step 1: Find the mean. To find the mean, add up all the scores, then divide them by the number of scores. ... Step 2: Find each score's deviation from the mean. ... Step 3: Square each deviation from the mean. ... Step 4: Find the sum of squares. ... Step 5: Divide the sum of squares by n – 1 or N.
kenneth
what is error
Yakuba Reply
Is mistake done to something
Vutshila
Hy
anas
hy
What is the life teble
anas
hy
Jibrin
statistics is the analyzing of data
Tajudeen Reply
what is statics?
Zelalem Reply
how do you calculate mean
Gloria Reply
diveving the sum if all values
Shaynaynay
let A1,A2 and A3 events be independent,show that (A1)^c, (A2)^c and (A3)^c are independent?
Fisaye Reply
what is statistics
Akhisani Reply
data collected all over the world
Shaynaynay
construct a less than and more than table
Imad Reply
The sample of 16 students is taken. The average age in the sample was 22 years with astandard deviation of 6 years. Construct a 95% confidence interval for the age of the population.
Aschalew Reply
Bhartdarshan' is an internet-based travel agency wherein customer can see videos of the cities they plant to visit. The number of hits daily is a normally distributed random variable with a mean of 10,000 and a standard deviation of 2,400 a. what is the probability of getting more than 12,000 hits? b. what is the probability of getting fewer than 9,000 hits?
Akshay Reply
Bhartdarshan'is an internet-based travel agency wherein customer can see videos of the cities they plan to visit. The number of hits daily is a normally distributed random variable with a mean of 10,000 and a standard deviation of 2,400. a. What is the probability of getting more than 12,000 hits
Akshay
1
Bright
Sorry i want to learn more about this question
Bright
Someone help
Bright
a= 0.20233 b=0.3384
Sufiyan
a
Shaynaynay
How do I interpret level of significance?
Mohd Reply
It depends on your business problem or in Machine Learning you could use ROC- AUC cruve to decide the threshold value
Shivam
how skewness and kurtosis are used in statistics
Owen Reply
yes what is it
Taneeya
Got questions? Join the online conversation and get instant answers!
Jobilize.com Reply
Practice Key Terms 4

Get Jobilize Job Search Mobile App in your pocket Now!

Get it on Google Play Download on the App Store Now


Source:  OpenStax, College physics for ap® courses. OpenStax CNX. Nov 04, 2016 Download for free at https://legacy.cnx.org/content/col11844/1.14
Google Play and the Google Play logo are trademarks of Google Inc.

Notification Switch

Would you like to follow the 'College physics for ap® courses' conversation and receive update notifications?

Ask