<< Chapter < Page Chapter >> Page >

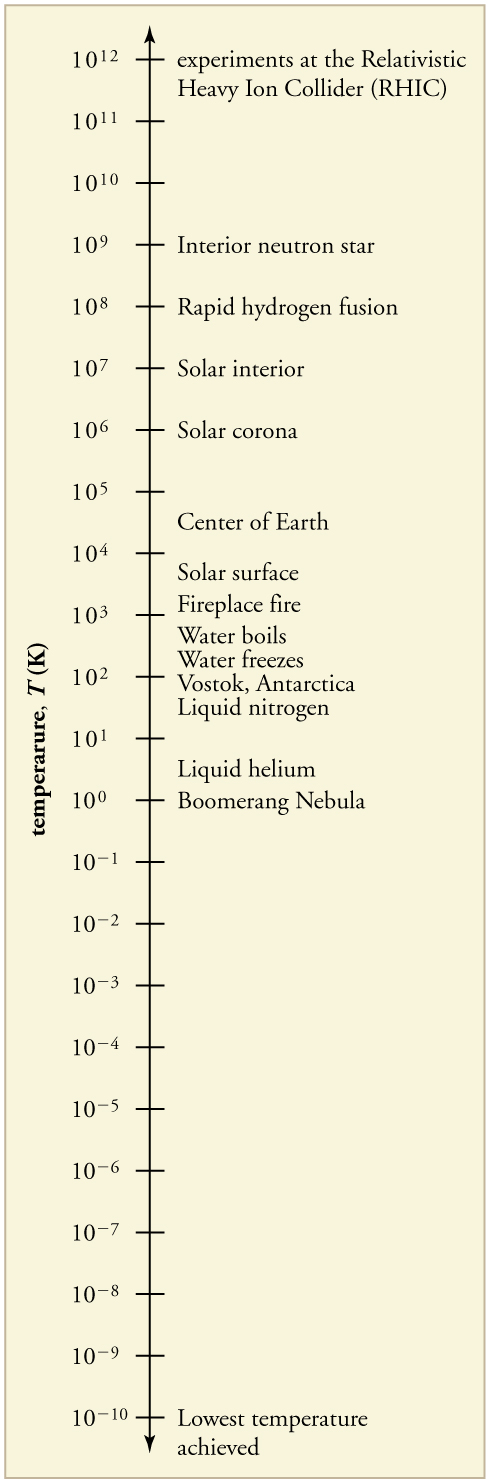
The lowest temperatures ever recorded have been measured during laboratory experiments: 4 . 5 × 10 10 K size 12{4 "." 5 times "10" rSup { size 8{–"10"} } " K"} {} at the Massachusetts Institute of Technology (USA), and 1 . 0 × 10 10 K size 12{1 "." 0 times "10" rSup { size 8{–"10"} } " K"} {} at Helsinki University of Technology (Finland). In comparison, the coldest recorded place on Earth’s surface is Vostok, Antarctica at 183 K ( 89 º C ) size 12{ \( –"89"°C \) } {} , and the coldest place (outside the lab) known in the universe is the Boomerang Nebula, with a temperature of 1 K.

The figure is a single vertical axis showing a wide range of temperatures on a logarithmic scale, measured in kelvin. The temperature range goes from the lowest temperature achieved at ten to the power of negative ten kelvin up to the temperature in experiments at the Relativistic Heavy Ion Collider at ten to the power of positive twelve kelvin.
Each increment on this logarithmic scale indicates an increase by a factor of ten, and thus illustrates the tremendous range of temperatures in nature. Note that zero on a logarithmic scale would occur off the bottom of the page at infinity.

Making connections: absolute zero

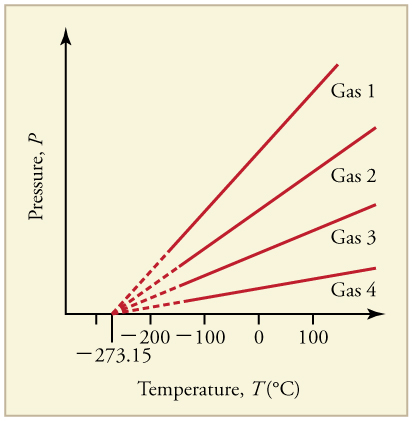
What is absolute zero? Absolute zero is the temperature at which all molecular motion has ceased. The concept of absolute zero arises from the behavior of gases. [link] shows how the pressure of gases at a constant volume decreases as temperature decreases. Various scientists have noted that the pressures of gases extrapolate to zero at the same temperature, 273 . 15 º C size 12{–"273" "." "15"°C} {} . This extrapolation implies that there is a lowest temperature. This temperature is called absolute zero . Today we know that most gases first liquefy and then freeze, and it is not actually possible to reach absolute zero. The numerical value of absolute zero temperature is 273 . 15 º C size 12{–"273" "." "15"°C} {} or 0 K.

Line graph of pressure versus temperature of five gases. Each graph is linear with a positive slope. Each line extrapolates to a pressure of zero at a temperature of negative two hundred seventy three point one five degrees Celsius.
Graph of pressure versus temperature for various gases kept at a constant volume. Note that all of the graphs extrapolate to zero pressure at the same temperature.

Thermal equilibrium and the zeroth law of thermodynamics

Thermometers actually take their own temperature, not the temperature of the object they are measuring. This raises the question of how we can be certain that a thermometer measures the temperature of the object with which it is in contact. It is based on the fact that any two systems placed in thermal contact (meaning heat transfer can occur between them) will reach the same temperature. That is, heat will flow from the hotter object to the cooler one until they have exactly the same temperature. The objects are then in thermal equilibrium    , and no further changes will occur. The systems interact and change because their temperatures differ, and the changes stop once their temperatures are the same. Thus, if enough time is allowed for this transfer of heat to run its course, the temperature a thermometer registers does represent the system with which it is in thermal equilibrium. Thermal equilibrium is established when two bodies are in contact with each other and can freely exchange energy.

Furthermore, experimentation has shown that if two systems, A and B, are in thermal equilibrium with each another, and B is in thermal equilibrium with a third system C, then A is also in thermal equilibrium with C. This conclusion may seem obvious, because all three have the same temperature, but it is basic to thermodynamics. It is called the zeroth law of thermodynamics    .

The zeroth law of thermodynamics

If two systems, A and B, are in thermal equilibrium with each other, and B is in thermal equilibrium with a third system, C, then A is also in thermal equilibrium with C.

Questions & Answers

it is the relatively stable flow of income
Chidubem Reply
what is circular flow of income
Divine Reply
branches of macroeconomics
SHEDRACK Reply
what is Flexible exchang rate?
poudel Reply
is gdp a reliable measurement of wealth
Atega Reply
introduction to econometrics
Husseini Reply
Hi
mostafa
hi
LEMLEM
hello
Sammol
hi
Mahesh
bi
Ruqayat
hi
Ruqayat
Hi fellas
Nyawa
hey
Sammol
hi
God
hello
Jahara
Good morning
Jorge
hi
abubakar
hi
Nmesoma
hi
Mahesh
Hi
Tom
Why is unemployment rate never zero at full employment?
Priyanka Reply
bcoz of existence of frictional unemployment in our economy.
Umashankar
what is flexible exchang rate?
poudel
due to existence of the pple with disabilities
Abdulraufu
the demand of a good rises, causing the demand for another good to fall
Rushawn Reply
is it possible to leave every good at the same level
Joseph
I don't think so. because check it, if the demand for chicken increases, people will no longer consume fish like they used to causing a fall in the demand for fish
Anuolu
is not really possible to let the value of a goods to be same at the same time.....
Salome
Suppose the inflation rate is 6%, does it mean that all the goods you purchase will cost 6% more than previous year? Provide with reasoning.
Geetha Reply
Not necessarily. To measure the inflation rate economists normally use an averaged price index of a basket of certain goods. So if you purchase goods included in the basket, you will notice that you pay 6% more, otherwise not necessarily.
Waeth
discus major problems of macroeconomics
Alii Reply
what is the problem of macroeconomics
Yoal
Economic growth Stable prices and low unemployment
Ephraim
explain inflationcause and itis degre
Miresa Reply
what is inflation
Getu
increase in general price levels
WEETO
Good day How do I calculate this question: C= 100+5yd G= 2000 T= 2000 I(planned)=200. Suppose the actual output is 3000. What is the level of planned expenditures at this level of output?
Chisomo Reply
how to calculate actual output?
Chisomo
how to calculate the equilibrium income
Beshir
Criteria for determining money supply
Thapase Reply
who we can define macroeconomics in one line
Muhammad
Aggregate demand
Mohammed
C=k100 +9y and i=k50.calculate the equilibrium level of output
Mercy Reply
Hi
Isiaka
Hi
Geli
hy
Man
👋
Bahunda
hy how are you?
Man
ys
Amisha
how are you guys
Sekou
f9 guys
Amisha
how are you guys
Sekou
ys am also fine
Amisha
fine and you guys
Geli
from Nepal
Amisha
nawalparasi district from belatari
Amisha
nd u
Amisha
I am Camara from Guinea west Africa... happy to meet you guys here
Sekou
ma management ho
Amisha
ahile becheclor ho
Amisha
hjr ktm bta ho ani k kaam grnu hunxa tw
Amisha
belatari
Amisha
1st year ho
Amisha
nd u
Amisha
ahh
Amisha
kaha biratnagar
Amisha
ys
Amisha
kina k vo
Amisha
money as unit of account means what?
Kalombe
A unit of account is something that can be used to value goods and services and make calculations
Jim
all of you please speak in English I can't understand you're language
Muhammad
I want to know how can we define macroeconomics in one line
Muhammad
it must be .9 or 0.9 no Mpc is greater than 1 Y=100+.9Y+50 Y-.9Y=150 0.1Y/0.1=150/0.1 Y=1500
Kalombe
Mercy is it clear?😋
Kalombe
hi can someone help me on this question If a negative shocks shifts the IS curve to the left, what type of policy do you suggest so as to stabilize the level of output? discuss your answer using appropriate graph.
Galge Reply
if interest rate is increased this will will reduce the level of income shifting the curve to the left ◀️
Kalombe
Got questions? Join the online conversation and get instant answers!
Jobilize.com Reply
Practice Key Terms 9

Get Jobilize Job Search Mobile App in your pocket Now!

Get it on Google Play Download on the App Store Now


Source:  OpenStax, College physics for ap® courses. OpenStax CNX. Nov 04, 2016 Download for free at https://legacy.cnx.org/content/col11844/1.14
Google Play and the Google Play logo are trademarks of Google Inc.

Notification Switch

Would you like to follow the 'College physics for ap® courses' conversation and receive update notifications?

Ask