<< Chapter < Page Chapter >> Page >

Now, let us talk about direct evidence

At first, physicists expected that, with sufficient energy, we should be able to free quarks and observe them directly. This has not proved possible. There is still no direct observation of a fractional charge or any isolated quark. When large energies are put into collisions, other particles are created—but no quarks emerge. There is nearly direct evidence for quarks that is quite compelling. By 1967, experiments at SLAC scattering 20-GeV electrons from protons had produced results like Rutherford had obtained for the nucleus nearly 60 years earlier. The SLAC scattering experiments showed unambiguously that there were three pointlike (meaning they had sizes considerably smaller than the probe's wavelength) charges inside the proton as seen in [link] . This evidence made all but the most skeptical admit that there was validity to the quark substructure of hadrons.

The image shows a big sphere labeled proton. Five electrons are shown impinging on the proton from the left. Two pass directly through the proton, one electron scatters back and down from a green up quark, another electron scatters back and up from a blue up quark, and the last electron scatters up and forward from a red down quark.
Scattering of high-energy electrons from protons at facilities like SLAC produces evidence of three point-like charges consistent with proposed quark properties. This experiment is analogous to Rutherford's discovery of the small size of the nucleus by scattering α particles. High-energy electrons are used so that the probe wavelength is small enough to see details smaller than the proton.

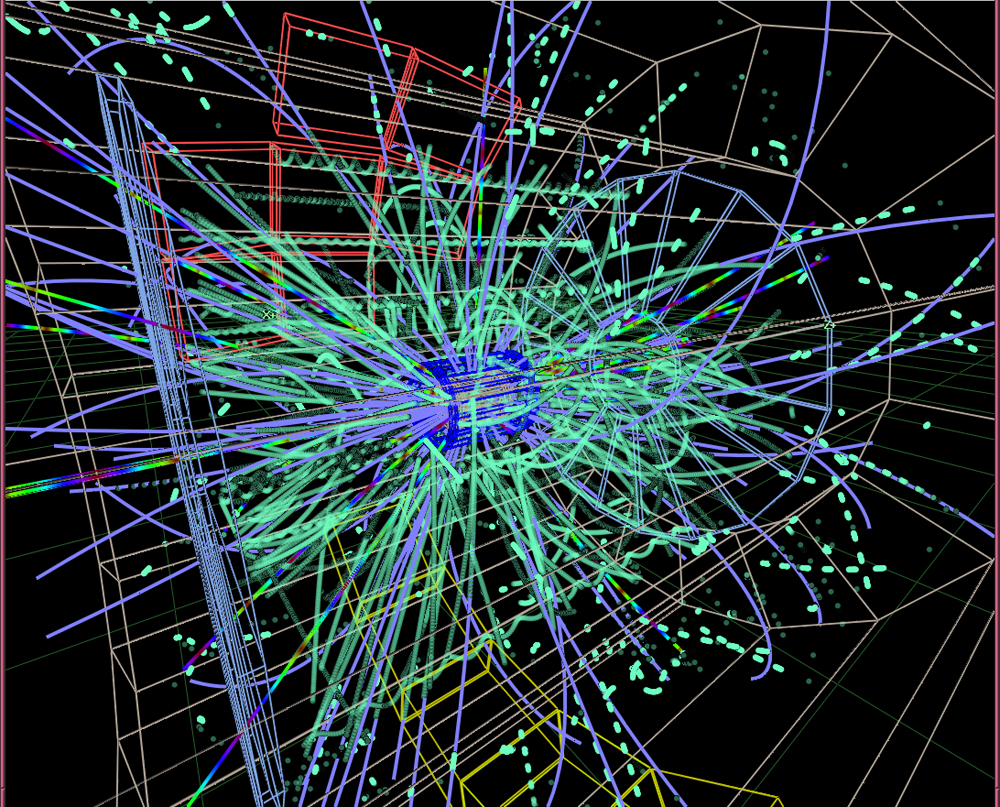
More recent and higher-energy experiments have produced jets of particles in collisions, highly suggestive of three quarks in a nucleon. Since the quarks are very tightly bound, energy put into separating them pulls them only so far apart before it starts being converted into other particles. More energy produces more particles, not a separation of quarks. Conservation of momentum requires that the particles come out in jets along the three paths in which the quarks were being pulled. Note that there are only three jets, and that other characteristics of the particles are consistent with the three-quark substructure.

In the figure the track of particles in electron-positron collider is shown/
Simulation of a proton-proton collision at 14-TeV center-of-mass energy in the ALICE detector at CERN LHC. The lines follow particle trajectories and the cyan dots represent the energy depositions in the sensitive detector elements. (credit: Matevž Tadel)

Quarks have their ups and downs

The quark model actually lost some of its early popularity because the original model with three quarks had to be modified. The up and down quarks seemed to compose normal matter as seen in [link] , while the single strange quark explained strangeness. Why didn't it have a counterpart? A fourth quark flavor called charm    ( c ) was proposed as the counterpart of the strange quark to make things symmetric—there would be two normal quarks ( u and d ) and two exotic quarks ( s and c ). Furthermore, at that time only four leptons were known, two normal and two exotic. It was attractive that there would be four quarks and four leptons. The problem was that no known particles contained a charmed quark. Suddenly, in November of 1974, two groups (one headed by C. C. Ting at Brookhaven National Laboratory and the other by Burton Richter at SLAC) independently and nearly simultaneously discovered a new meson with characteristics that made it clear that its substructure is c c - size 12{c { bar {c}}} {} . It was called J by one group and psi ( ψ size 12{ψ} {} ) by the other and now is known as the J / ψ size 12{J/ψ} {} meson. Since then, numerous particles have been discovered containing the charmed quark, consistent in every way with the quark model. The discovery of the J / ψ size 12{J/ψ} {} meson had such a rejuvenating effect on quark theory that it is now called the November Revolution. Ting and Richter shared the 1976 Nobel Prize.

Questions & Answers

how do you get the 2/50
Abba Reply
number of sport play by 50 student construct discrete data
Aminu Reply
width of the frangebany leaves on how to write a introduction
Theresa Reply
Solve the mean of variance
Veronica Reply
Step 1: Find the mean. To find the mean, add up all the scores, then divide them by the number of scores. ... Step 2: Find each score's deviation from the mean. ... Step 3: Square each deviation from the mean. ... Step 4: Find the sum of squares. ... Step 5: Divide the sum of squares by n – 1 or N.
kenneth
what is error
Yakuba Reply
Is mistake done to something
Vutshila
Hy
anas
hy
What is the life teble
anas
hy
Jibrin
statistics is the analyzing of data
Tajudeen Reply
what is statics?
Zelalem Reply
how do you calculate mean
Gloria Reply
diveving the sum if all values
Shaynaynay
let A1,A2 and A3 events be independent,show that (A1)^c, (A2)^c and (A3)^c are independent?
Fisaye Reply
what is statistics
Akhisani Reply
data collected all over the world
Shaynaynay
construct a less than and more than table
Imad Reply
The sample of 16 students is taken. The average age in the sample was 22 years with astandard deviation of 6 years. Construct a 95% confidence interval for the age of the population.
Aschalew Reply
Bhartdarshan' is an internet-based travel agency wherein customer can see videos of the cities they plant to visit. The number of hits daily is a normally distributed random variable with a mean of 10,000 and a standard deviation of 2,400 a. what is the probability of getting more than 12,000 hits? b. what is the probability of getting fewer than 9,000 hits?
Akshay Reply
Bhartdarshan'is an internet-based travel agency wherein customer can see videos of the cities they plan to visit. The number of hits daily is a normally distributed random variable with a mean of 10,000 and a standard deviation of 2,400. a. What is the probability of getting more than 12,000 hits
Akshay
1
Bright
Sorry i want to learn more about this question
Bright
Someone help
Bright
a= 0.20233 b=0.3384
Sufiyan
a
Shaynaynay
How do I interpret level of significance?
Mohd Reply
It depends on your business problem or in Machine Learning you could use ROC- AUC cruve to decide the threshold value
Shivam
how skewness and kurtosis are used in statistics
Owen Reply
yes what is it
Taneeya
Got questions? Join the online conversation and get instant answers!
Jobilize.com Reply

Get Jobilize Job Search Mobile App in your pocket Now!

Get it on Google Play Download on the App Store Now


Source:  OpenStax, College physics for ap® courses. OpenStax CNX. Nov 04, 2016 Download for free at https://legacy.cnx.org/content/col11844/1.14
Google Play and the Google Play logo are trademarks of Google Inc.

Notification Switch

Would you like to follow the 'College physics for ap® courses' conversation and receive update notifications?

Ask