<< Chapter < Page Chapter >> Page >

Learning objectives

By the end of this section, you will be able to:

  • Interpret a phase diagram.
  • State Dalton’s law.
  • Identify and describe the triple point of a gas from its phase diagram.
  • Describe the state of equilibrium between a liquid and a gas, a liquid and a solid, and a gas and a solid.

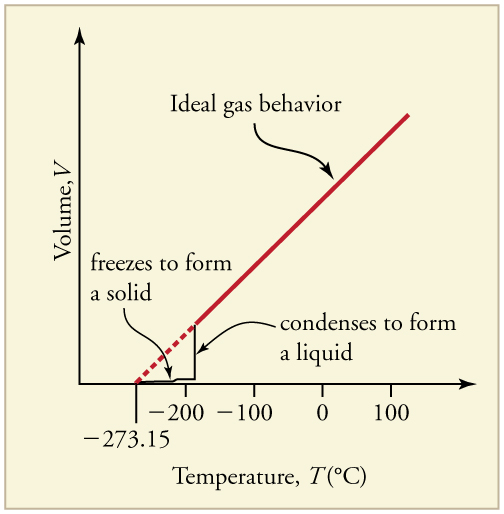
Up to now, we have considered the behavior of ideal gases. Real gases are like ideal gases at high temperatures. At lower temperatures, however, the interactions between the molecules and their volumes cannot be ignored. The molecules are very close (condensation occurs) and there is a dramatic decrease in volume, as seen in [link] . The substance changes from a gas to a liquid. When a liquid is cooled to even lower temperatures, it becomes a solid. The volume never reaches zero because of the finite volume of the molecules.

Line graph of volume versus temperature showing the relationship for an ideal gas and a real gas. The line for an ideal gas is linear starting at absolute zero showing a linear increase in volume with temperature. The line for a real gas is linear above a temperature of negative one hundred ninety degrees Celsius and follows that of the ideal gas. But below that temperature, the graph shows an almost vertical drop in volume with temperature as the temperature drops and the gas condenses.
A sketch of volume versus temperature for a real gas at constant pressure. The linear (straight line) part of the graph represents ideal gas behavior—volume and temperature are directly and positively related and the line extrapolates to zero volume at 273 . 15 º C size 12{ +- "273" "." "15"°C} {} , or absolute zero. When the gas becomes a liquid, however, the volume actually decreases precipitously at the liquefaction point. The volume decreases slightly once the substance is solid, but it never becomes zero.

High pressure may also cause a gas to change phase to a liquid. Carbon dioxide, for example, is a gas at room temperature and atmospheric pressure, but becomes a liquid under sufficiently high pressure. If the pressure is reduced, the temperature drops and the liquid carbon dioxide solidifies into a snow-like substance at the temperature 78 º C size 12{ +- "78"°C} {} . Solid CO 2 size 12{"CO" rSub { size 8{2} } } {} is called “dry ice.” Another example of a gas that can be in a liquid phase is liquid nitrogen ( LN 2 ) size 12{ \( "LN" rSub { size 8{2} } \) } {} . LN 2 size 12{"LN" rSub { size 8{2} } } {} is made by liquefaction of atmospheric air (through compression and cooling). It boils at 77 K ( 196 º C ) size 12{ \( –"196"°C \) } {} at atmospheric pressure. LN 2 size 12{"LN" rSub { size 8{2} } } {} is useful as a refrigerant and allows for the preservation of blood, sperm, and other biological materials. It is also used to reduce noise in electronic sensors and equipment, and to help cool down their current-carrying wires. In dermatology, LN 2 size 12{"LN" rSub { size 8{2} } } {} is used to freeze and painlessly remove warts and other growths from the skin.

PV Diagrams

We can examine aspects of the behavior of a substance by plotting a graph of pressure versus volume, called a PV diagram    . When the substance behaves like an ideal gas, the ideal gas law describes the relationship between its pressure and volume. That is,

PV = NkT ( ideal gas ) . size 12{ ital "PV"= ital "NkT"``` \( "ideal gas" \) "." } {}

Now, assuming the number of molecules and the temperature are fixed,

PV = constant ( ideal gas, constant temperature ) . size 12{ size 11{ ital "PV"="constant"``` \( "ideal gas, constant temperature" \) "." }} {}

For example, the volume of the gas will decrease as the pressure increases. If you plot the relationship PV = constant size 12{ size 11{ ital "PV"="constant"}} {} on a PV size 12{ ital "PV"} {} diagram, you find a hyperbola. [link] shows a graph of pressure versus volume. The hyperbolas represent ideal-gas behavior at various fixed temperatures, and are called isotherms . At lower temperatures, the curves begin to look less like hyperbolas—the gas is not behaving ideally and may even contain liquid. There is a critical point    —that is, a critical temperature    —above which liquid cannot exist. At sufficiently high pressure above the critical point, the gas will have the density of a liquid but will not condense. Carbon dioxide, for example, cannot be liquefied at a temperature above 31 . 0 º C size 12{"31" "." 0°C} {} . Critical pressure is the minimum pressure needed for liquid to exist at the critical temperature. [link] lists representative critical temperatures and pressures.

Questions & Answers

it is the relatively stable flow of income
Chidubem Reply
what is circular flow of income
Divine Reply
branches of macroeconomics
SHEDRACK Reply
what is Flexible exchang rate?
poudel Reply
is gdp a reliable measurement of wealth
Atega Reply
introduction to econometrics
Husseini Reply
Hi
mostafa
hi
LEMLEM
hello
Sammol
hi
Mahesh
bi
Ruqayat
hi
Ruqayat
Hi fellas
Nyawa
hey
Sammol
hi
God
hello
Jahara
Good morning
Jorge
hi
abubakar
hi
Nmesoma
hi
Mahesh
Hi
Tom
Why is unemployment rate never zero at full employment?
Priyanka Reply
bcoz of existence of frictional unemployment in our economy.
Umashankar
what is flexible exchang rate?
poudel
due to existence of the pple with disabilities
Abdulraufu
the demand of a good rises, causing the demand for another good to fall
Rushawn Reply
is it possible to leave every good at the same level
Joseph
I don't think so. because check it, if the demand for chicken increases, people will no longer consume fish like they used to causing a fall in the demand for fish
Anuolu
is not really possible to let the value of a goods to be same at the same time.....
Salome
Suppose the inflation rate is 6%, does it mean that all the goods you purchase will cost 6% more than previous year? Provide with reasoning.
Geetha Reply
Not necessarily. To measure the inflation rate economists normally use an averaged price index of a basket of certain goods. So if you purchase goods included in the basket, you will notice that you pay 6% more, otherwise not necessarily.
Waeth
discus major problems of macroeconomics
Alii Reply
what is the problem of macroeconomics
Yoal
Economic growth Stable prices and low unemployment
Ephraim
explain inflationcause and itis degre
Miresa Reply
what is inflation
Getu
increase in general price levels
WEETO
Good day How do I calculate this question: C= 100+5yd G= 2000 T= 2000 I(planned)=200. Suppose the actual output is 3000. What is the level of planned expenditures at this level of output?
Chisomo Reply
how to calculate actual output?
Chisomo
how to calculate the equilibrium income
Beshir
Criteria for determining money supply
Thapase Reply
who we can define macroeconomics in one line
Muhammad
Aggregate demand
Mohammed
C=k100 +9y and i=k50.calculate the equilibrium level of output
Mercy Reply
Hi
Isiaka
Hi
Geli
hy
Man
👋
Bahunda
hy how are you?
Man
ys
Amisha
how are you guys
Sekou
f9 guys
Amisha
how are you guys
Sekou
ys am also fine
Amisha
fine and you guys
Geli
from Nepal
Amisha
nawalparasi district from belatari
Amisha
nd u
Amisha
I am Camara from Guinea west Africa... happy to meet you guys here
Sekou
ma management ho
Amisha
ahile becheclor ho
Amisha
hjr ktm bta ho ani k kaam grnu hunxa tw
Amisha
belatari
Amisha
1st year ho
Amisha
nd u
Amisha
ahh
Amisha
kaha biratnagar
Amisha
ys
Amisha
kina k vo
Amisha
money as unit of account means what?
Kalombe
A unit of account is something that can be used to value goods and services and make calculations
Jim
all of you please speak in English I can't understand you're language
Muhammad
I want to know how can we define macroeconomics in one line
Muhammad
it must be .9 or 0.9 no Mpc is greater than 1 Y=100+.9Y+50 Y-.9Y=150 0.1Y/0.1=150/0.1 Y=1500
Kalombe
Mercy is it clear?😋
Kalombe
hi can someone help me on this question If a negative shocks shifts the IS curve to the left, what type of policy do you suggest so as to stabilize the level of output? discuss your answer using appropriate graph.
Galge Reply
if interest rate is increased this will will reduce the level of income shifting the curve to the left ◀️
Kalombe
Got questions? Join the online conversation and get instant answers!
Jobilize.com Reply

Get Jobilize Job Search Mobile App in your pocket Now!

Get it on Google Play Download on the App Store Now


Source:  OpenStax, College physics for ap® courses. OpenStax CNX. Nov 04, 2016 Download for free at https://legacy.cnx.org/content/col11844/1.14
Google Play and the Google Play logo are trademarks of Google Inc.

Notification Switch

Would you like to follow the 'College physics for ap® courses' conversation and receive update notifications?

Ask