<< Chapter < Page Chapter >> Page >
First of four images shows an incident ray 1 coming from an object (a girl ) placed on the axis. After refraction, the ray passes through F on other side of the lens. Second of four images shows an incident ray 2 passing through the center without any deviation. Third of four images shows an incident ray passing through F, which after refraction goes parallel to the axis. Fourth image shows a combination of all three rays, 1, 2, and 3, incident on a convex lens; after refraction, they converge or cross at a point below the axis at some distance from F. Here the height of the object h sub o is the height of the girl above the axis and h sub i is the height of the image below the axis. The distance from the center to point F is small f. The distance from the center to the girl is d sub o and that to the image is d sub i.
Ray tracing is used to locate the image formed by a lens. Rays originating from the same point on the object are traced—the three chosen rays each follow one of the rules for ray tracing, so that their paths are easy to determine. The image is located at the point where the rays cross. In this case, a real image—one that can be projected on a screen—is formed.

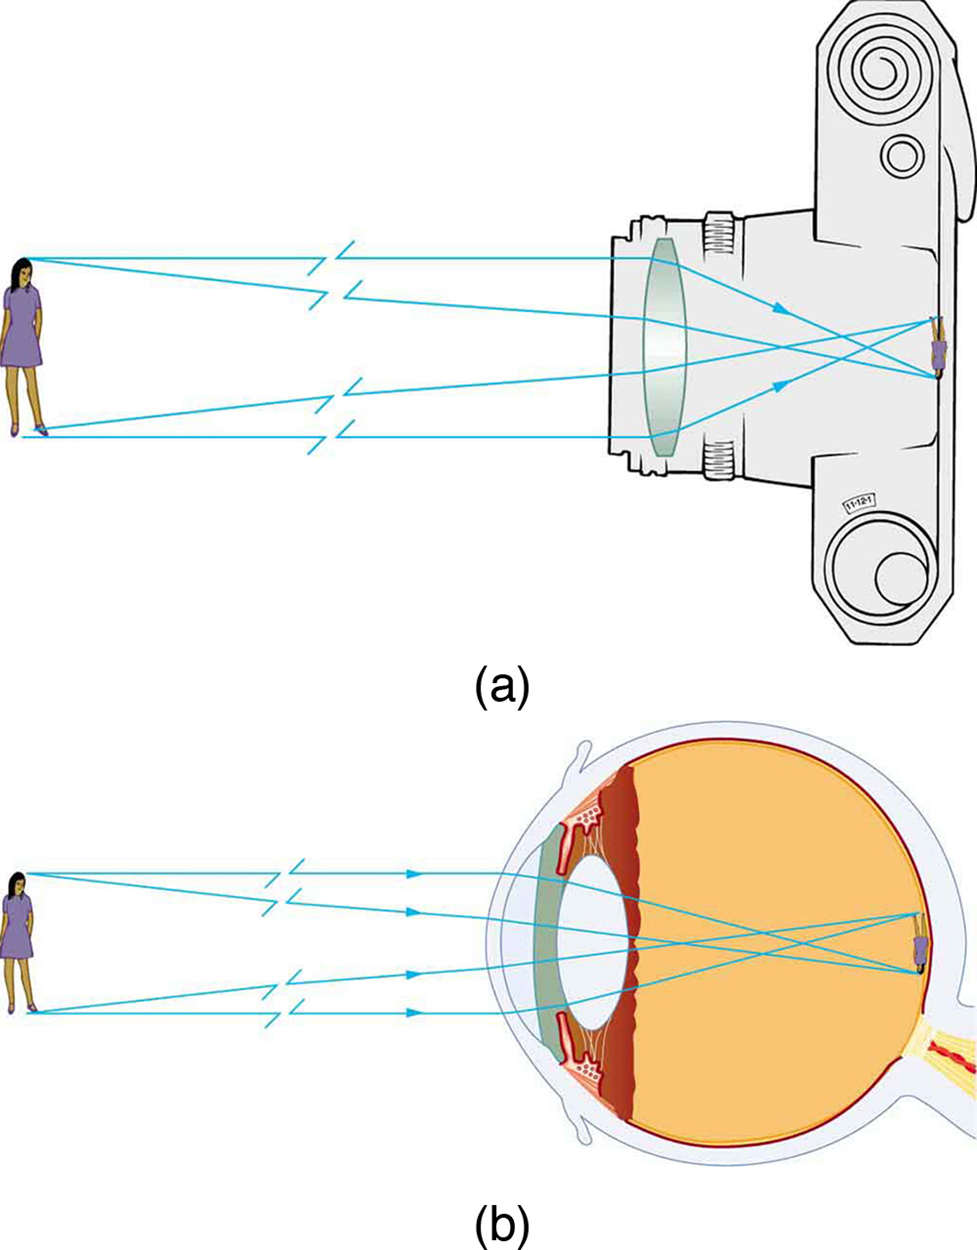
The image formed in [link] is a real image    , meaning that it can be projected. That is, light rays from one point on the object actually cross at the location of the image and can be projected onto a screen, a piece of film, or the retina of an eye, for example. [link] shows how such an image would be projected onto film by a camera lens. This figure also shows how a real image is projected onto the retina by the lens of an eye. Note that the image is there whether it is projected onto a screen or not.

Real image

The image in which light rays from one point on the object actually cross at the location of the image and can be projected onto a screen, a piece of film, or the retina of an eye is called a real image.

Figure (a) shows incident rays coming from an object (a girl) and falling on a convex lens in a camera. The rays after refraction produce an inverted, real, and diminished image on the film of the camera. Figure (b) shows the same object in front of a human eye. The rays from the object fall on the convex lens and on refraction produce a real, inverted, and diminished image on the retina of the eyeball.
Real images can be projected. (a) A real image of the person is projected onto film. (b) The converging nature of the multiple surfaces that make up the eye result in the projection of a real image on the retina.

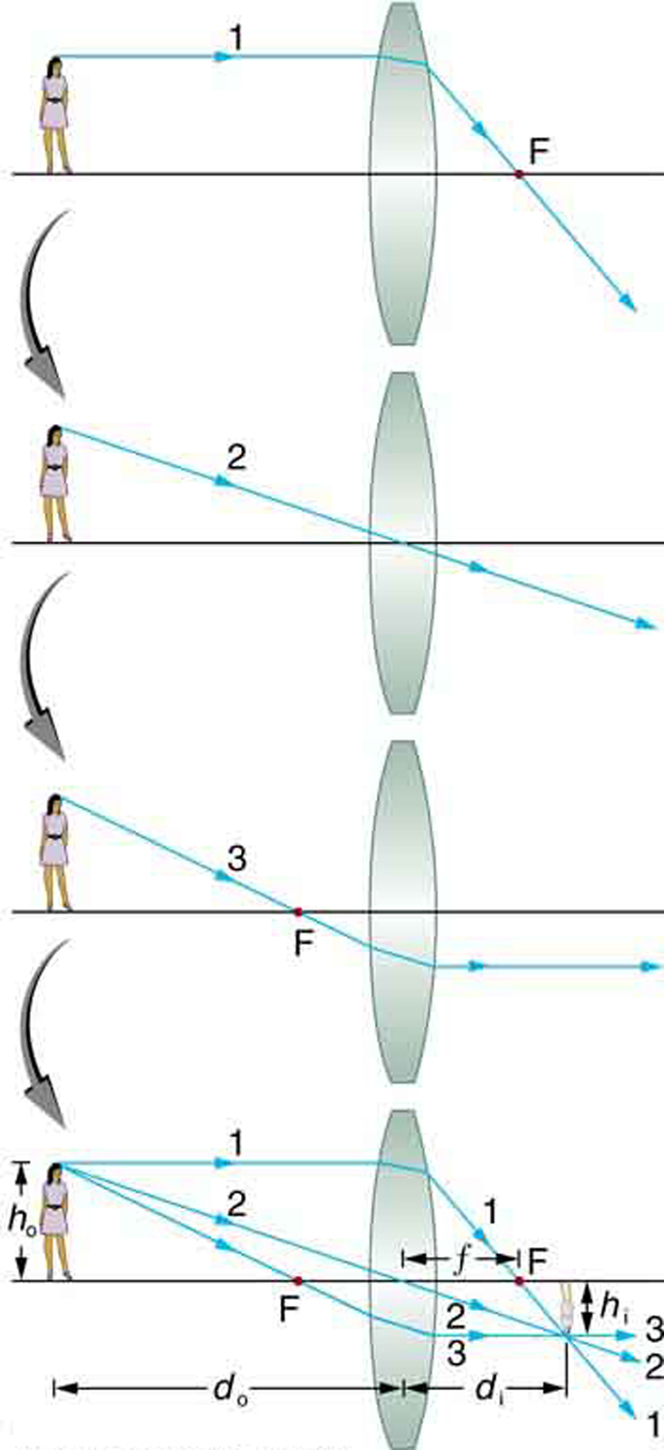
Several important distances appear in [link] . We define d o to be the object distance, the distance of an object from the center of a lens. Image distance d i is defined to be the distance of the image from the center of a lens. The height of the object and height of the image are given the symbols h o and h i , respectively. Images that appear upright relative to the object have heights that are positive and those that are inverted have negative heights. Using the rules of ray tracing and making a scale drawing with paper and pencil, like that in [link] , we can accurately describe the location and size of an image. But the real benefit of ray tracing is in visualizing how images are formed in a variety of situations. To obtain numerical information, we use a pair of equations that can be derived from a geometric analysis of ray tracing for thin lenses. The thin lens equations are

1 d o + 1 d i = 1 f

and

h i h o = d i d o = m.

We define the ratio of image height to object height ( h i / h o size 12{h rSub { size 8{i} } /h rSub { size 8{o} } } {} ) to be the magnification     m size 12{m} {} . (The minus sign in the equation above will be discussed shortly.) The thin lens equations are broadly applicable to all situations involving thin lenses (and “thin” mirrors, as we will see later). We will explore many features of image formation in the following worked examples.

Image distance

The distance of the image from the center of the lens is called image distance.

Thin lens equations and magnification

1 d o + 1 d i = 1 f
h i h o = d i d o = m

Finding the image of a light bulb filament by ray tracing and by the thin lens equations

A clear glass light bulb is placed 0.750 m from a convex lens having a 0.500 m focal length, as shown in [link] . Use ray tracing to get an approximate location for the image. Then use the thin lens equations to calculate (a) the location of the image and (b) its magnification. Verify that ray tracing and the thin lens equations produce consistent results.

Questions & Answers

differentiate between demand and supply giving examples
Lambiv Reply
differentiated between demand and supply using examples
Lambiv
what is labour ?
Lambiv
how will I do?
Venny Reply
how is the graph works?I don't fully understand
Rezat Reply
information
Eliyee
devaluation
Eliyee
t
WARKISA
hi guys good evening to all
Lambiv
multiple choice question
Aster Reply
appreciation
Eliyee
explain perfect market
Lindiwe Reply
In economics, a perfect market refers to a theoretical construct where all participants have perfect information, goods are homogenous, there are no barriers to entry or exit, and prices are determined solely by supply and demand. It's an idealized model used for analysis,
Ezea
What is ceteris paribus?
Shukri Reply
other things being equal
AI-Robot
When MP₁ becomes negative, TP start to decline. Extuples Suppose that the short-run production function of certain cut-flower firm is given by: Q=4KL-0.6K2 - 0.112 • Where is quantity of cut flower produced, I is labour input and K is fixed capital input (K-5). Determine the average product of lab
Kelo
Extuples Suppose that the short-run production function of certain cut-flower firm is given by: Q=4KL-0.6K2 - 0.112 • Where is quantity of cut flower produced, I is labour input and K is fixed capital input (K-5). Determine the average product of labour (APL) and marginal product of labour (MPL)
Kelo
yes,thank you
Shukri
Can I ask you other question?
Shukri
what is monopoly mean?
Habtamu Reply
What is different between quantity demand and demand?
Shukri Reply
Quantity demanded refers to the specific amount of a good or service that consumers are willing and able to purchase at a give price and within a specific time period. Demand, on the other hand, is a broader concept that encompasses the entire relationship between price and quantity demanded
Ezea
ok
Shukri
how do you save a country economic situation when it's falling apart
Lilia Reply
what is the difference between economic growth and development
Fiker Reply
Economic growth as an increase in the production and consumption of goods and services within an economy.but Economic development as a broader concept that encompasses not only economic growth but also social & human well being.
Shukri
production function means
Jabir
What do you think is more important to focus on when considering inequality ?
Abdisa Reply
any question about economics?
Awais Reply
sir...I just want to ask one question... Define the term contract curve? if you are free please help me to find this answer 🙏
Asui
it is a curve that we get after connecting the pareto optimal combinations of two consumers after their mutually beneficial trade offs
Awais
thank you so much 👍 sir
Asui
In economics, the contract curve refers to the set of points in an Edgeworth box diagram where both parties involved in a trade cannot be made better off without making one of them worse off. It represents the Pareto efficient allocations of goods between two individuals or entities, where neither p
Cornelius
In economics, the contract curve refers to the set of points in an Edgeworth box diagram where both parties involved in a trade cannot be made better off without making one of them worse off. It represents the Pareto efficient allocations of goods between two individuals or entities,
Cornelius
Suppose a consumer consuming two commodities X and Y has The following utility function u=X0.4 Y0.6. If the price of the X and Y are 2 and 3 respectively and income Constraint is birr 50. A,Calculate quantities of x and y which maximize utility. B,Calculate value of Lagrange multiplier. C,Calculate quantities of X and Y consumed with a given price. D,alculate optimum level of output .
Feyisa Reply
Answer
Feyisa
c
Jabir
the market for lemon has 10 potential consumers, each having an individual demand curve p=101-10Qi, where p is price in dollar's per cup and Qi is the number of cups demanded per week by the i th consumer.Find the market demand curve using algebra. Draw an individual demand curve and the market dema
Gsbwnw Reply
suppose the production function is given by ( L, K)=L¼K¾.assuming capital is fixed find APL and MPL. consider the following short run production function:Q=6L²-0.4L³ a) find the value of L that maximizes output b)find the value of L that maximizes marginal product
Abdureman
types of unemployment
Yomi Reply
What is the difference between perfect competition and monopolistic competition?
Mohammed
Got questions? Join the online conversation and get instant answers!
Jobilize.com Reply
Practice Key Terms 8

Get Jobilize Job Search Mobile App in your pocket Now!

Get it on Google Play Download on the App Store Now


Source:  OpenStax, College physics for ap® courses. OpenStax CNX. Nov 04, 2016 Download for free at https://legacy.cnx.org/content/col11844/1.14
Google Play and the Google Play logo are trademarks of Google Inc.

Notification Switch

Would you like to follow the 'College physics for ap® courses' conversation and receive update notifications?

Ask