<< Chapter < Page Chapter >> Page >

Two general rules for combining quarks to form hadrons are:

  1. Baryons are composed of three quarks, and antibaryons are composed of three antiquarks.
  2. Mesons are combinations of a quark and an antiquark.

One of the clever things about this scheme is that only integral charges result, even though the quarks have fractional charge.

All combinations are possible

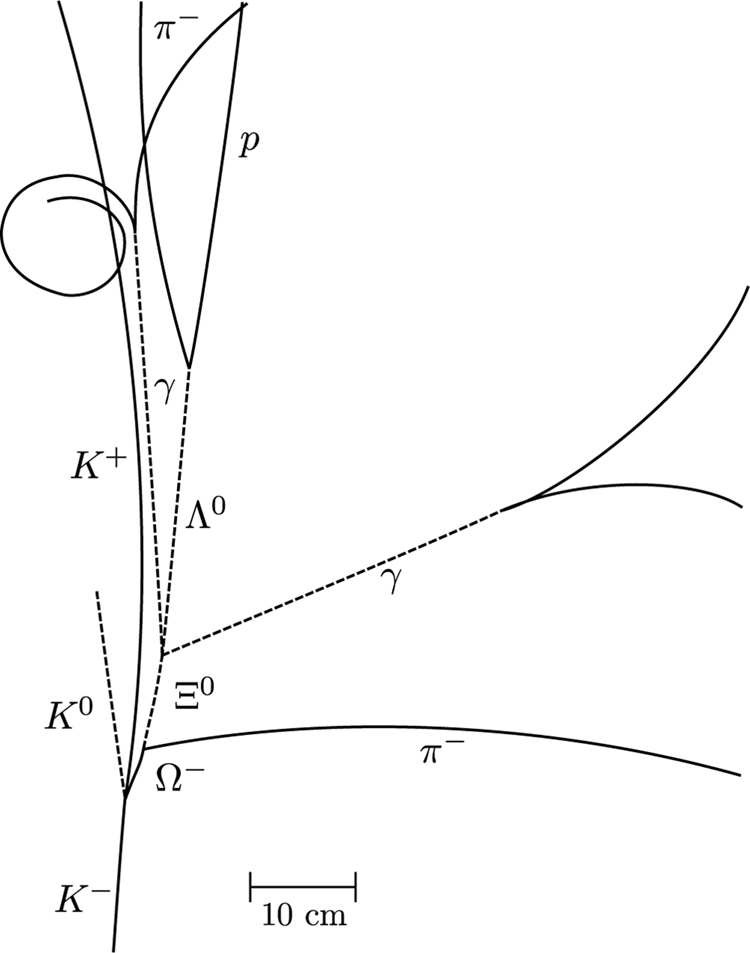
All quark combinations are possible. [link] lists some of these combinations. When Gell-Mann and Zweig proposed the original three quark flavors, particles corresponding to all combinations of those three had not been observed. The pattern was there, but it was incomplete—much as had been the case in the periodic table of the elements and the chart of nuclides. The Ω size 12{ %OMEGA rSup { size 8{ - {}} } } {} particle, in particular, had not been discovered but was predicted by quark theory. Its combination of three strange quarks, sss size 12{ ital "sss"} {} , gives it a strangeness of 3 size 12{ - 3} {} (see [link] ) and other predictable characteristics, such as spin, charge, approximate mass, and lifetime. If the quark picture is complete, the Ω size 12{ %OMEGA rSup { size 8{ - {}} } } {} should exist. It was first observed in 1964 at Brookhaven National Laboratory and had the predicted characteristics as seen in [link] . The discovery of the Ω size 12{ %OMEGA rSup { size 8{ - {}} } } {} was convincing indirect evidence for the existence of the three original quark flavors and boosted theoretical and experimental efforts to further explore particle physics in terms of quarks.

Patterns and puzzles: atoms, nuclei, and quarks

Patterns in the properties of atoms allowed the periodic table to be developed. From it, previously unknown elements were predicted and observed. Similarly, patterns were observed in the properties of nuclei, leading to the chart of nuclides and successful predictions of previously unknown nuclides. Now with particle physics, patterns imply a quark substructure that, if taken literally, predicts previously unknown particles. These have now been observed in another triumph of underlying unity.

The figure shows a trace of a bubble chamber picture that shows the first observation of an omega minus particle. The trace looks like the branch of a small bush. There is a stem at the bottom labeled K minus, then a vertex from which comes a short arched segment labeled omega minus. This segment branches into a dashed line labeled xi zero and an arched line labeled pie minus. Various other solid and dashed lines continue upwards with various labels, such as lambda zero, gamma, K plus, and so on. From the scale bar in the figure, the sigma minus segment is about five centimeters long, which is much shorter than most of the other segments.
The image relates to the discovery of the Ω size 12{ %OMEGA rSup { size 8{ - {}} } } {} . It is a secondary reaction in which an accelerator-produced K size 12{K rSup { size 8{ - {}} } } {} collides with a proton via the strong force and conserves strangeness to produce the Ω size 12{ %OMEGA rSup { size 8{ - {}} } } {} with characteristics predicted by the quark model. As with other predictions of previously unobserved particles, this gave a tremendous boost to quark theory. (credit: Brookhaven National Laboratory)

Quantum numbers from quark composition

Verify the quantum numbers given for the Ξ 0 size 12{Ξ rSup { size 8{0} } } {} particle in [link] by adding the quantum numbers for its quark composition as given in [link] .

Strategy

The composition of the Ξ 0 size 12{Ξ rSup { size 8{0} } } {} is given as uss size 12{ ital "uss"} {} in [link] . The quantum numbers for the constituent quarks are given in [link] . We will not consider spin, because that is not given for the Ξ 0 size 12{Ξ rSup { size 8{0} } } {} . But we can check on charge and the other quantum numbers given for the quarks.

Solution

The total charge of uss is + 2 3 q e 1 3 q e 1 3 q e = 0 size 12{+ left ( { {2} over {3} } right )q rSub { size 8{e} } - left ( { {1} over {3} } right )q rSub { size 8{e} } - left ( { {1} over {3} } right )q rSub { size 8{e} } =0} {} , which is correct for the Ξ 0 size 12{Ξ rSup { size 8{0} } } {} . The baryon number is + 1 3 + 1 3 + 1 3 = 1 size 12{+ left ( { {1} over {3} } right )+ left ( { {1} over {3} } right )+ left ( { {1} over {3} } right )=1} {} , also correct since the Ξ 0 size 12{Ξ rSup { size 8{0} } } {} is a matter baryon and has B = 1 size 12{B=1} {} , as listed in [link] . Its strangeness is S = 0 1 1 = 2 size 12{S=0 - 1 - 1= - 2} {} , also as expected from [link] . Its charm, bottomness, and topness are 0, as are its lepton family numbers (it is not a lepton).

Discussion

This procedure is similar to what the inventors of the quark hypothesis did when checking to see if their solution to the puzzle of particle patterns was correct. They also checked to see if all combinations were known, thereby predicting the previously unobserved Ω size 12{ %OMEGA rSup { size 8{ - {}} } } {} as the completion of a pattern.

Got questions? Get instant answers now!

Questions & Answers

differentiate between demand and supply giving examples
Lambiv Reply
differentiated between demand and supply using examples
Lambiv
what is labour ?
Lambiv
how will I do?
Venny Reply
how is the graph works?I don't fully understand
Rezat Reply
information
Eliyee
devaluation
Eliyee
t
WARKISA
hi guys good evening to all
Lambiv
multiple choice question
Aster Reply
appreciation
Eliyee
explain perfect market
Lindiwe Reply
In economics, a perfect market refers to a theoretical construct where all participants have perfect information, goods are homogenous, there are no barriers to entry or exit, and prices are determined solely by supply and demand. It's an idealized model used for analysis,
Ezea
What is ceteris paribus?
Shukri Reply
other things being equal
AI-Robot
When MP₁ becomes negative, TP start to decline. Extuples Suppose that the short-run production function of certain cut-flower firm is given by: Q=4KL-0.6K2 - 0.112 • Where is quantity of cut flower produced, I is labour input and K is fixed capital input (K-5). Determine the average product of lab
Kelo
Extuples Suppose that the short-run production function of certain cut-flower firm is given by: Q=4KL-0.6K2 - 0.112 • Where is quantity of cut flower produced, I is labour input and K is fixed capital input (K-5). Determine the average product of labour (APL) and marginal product of labour (MPL)
Kelo
yes,thank you
Shukri
Can I ask you other question?
Shukri
what is monopoly mean?
Habtamu Reply
What is different between quantity demand and demand?
Shukri Reply
Quantity demanded refers to the specific amount of a good or service that consumers are willing and able to purchase at a give price and within a specific time period. Demand, on the other hand, is a broader concept that encompasses the entire relationship between price and quantity demanded
Ezea
ok
Shukri
how do you save a country economic situation when it's falling apart
Lilia Reply
what is the difference between economic growth and development
Fiker Reply
Economic growth as an increase in the production and consumption of goods and services within an economy.but Economic development as a broader concept that encompasses not only economic growth but also social & human well being.
Shukri
production function means
Jabir
What do you think is more important to focus on when considering inequality ?
Abdisa Reply
any question about economics?
Awais Reply
sir...I just want to ask one question... Define the term contract curve? if you are free please help me to find this answer 🙏
Asui
it is a curve that we get after connecting the pareto optimal combinations of two consumers after their mutually beneficial trade offs
Awais
thank you so much 👍 sir
Asui
In economics, the contract curve refers to the set of points in an Edgeworth box diagram where both parties involved in a trade cannot be made better off without making one of them worse off. It represents the Pareto efficient allocations of goods between two individuals or entities, where neither p
Cornelius
In economics, the contract curve refers to the set of points in an Edgeworth box diagram where both parties involved in a trade cannot be made better off without making one of them worse off. It represents the Pareto efficient allocations of goods between two individuals or entities,
Cornelius
Suppose a consumer consuming two commodities X and Y has The following utility function u=X0.4 Y0.6. If the price of the X and Y are 2 and 3 respectively and income Constraint is birr 50. A,Calculate quantities of x and y which maximize utility. B,Calculate value of Lagrange multiplier. C,Calculate quantities of X and Y consumed with a given price. D,alculate optimum level of output .
Feyisa Reply
Answer
Feyisa
c
Jabir
the market for lemon has 10 potential consumers, each having an individual demand curve p=101-10Qi, where p is price in dollar's per cup and Qi is the number of cups demanded per week by the i th consumer.Find the market demand curve using algebra. Draw an individual demand curve and the market dema
Gsbwnw Reply
suppose the production function is given by ( L, K)=L¼K¾.assuming capital is fixed find APL and MPL. consider the following short run production function:Q=6L²-0.4L³ a) find the value of L that maximizes output b)find the value of L that maximizes marginal product
Abdureman
types of unemployment
Yomi Reply
What is the difference between perfect competition and monopolistic competition?
Mohammed
Got questions? Join the online conversation and get instant answers!
Jobilize.com Reply

Get Jobilize Job Search Mobile App in your pocket Now!

Get it on Google Play Download on the App Store Now


Source:  OpenStax, College physics for ap® courses. OpenStax CNX. Nov 04, 2016 Download for free at https://legacy.cnx.org/content/col11844/1.14
Google Play and the Google Play logo are trademarks of Google Inc.

Notification Switch

Would you like to follow the 'College physics for ap® courses' conversation and receive update notifications?

Ask