<< Chapter < Page Chapter >> Page >
  • Define half-life.
  • Define dating.
  • Calculate age of old objects by radioactive dating.

Unstable nuclei decay. However, some nuclides decay faster than others. For example, radium and polonium, discovered by the Curies, decay faster than uranium. This means they have shorter lifetimes, producing a greater rate of decay. In this section we explore half-life and activity, the quantitative terms for lifetime and rate of decay.

Half-life

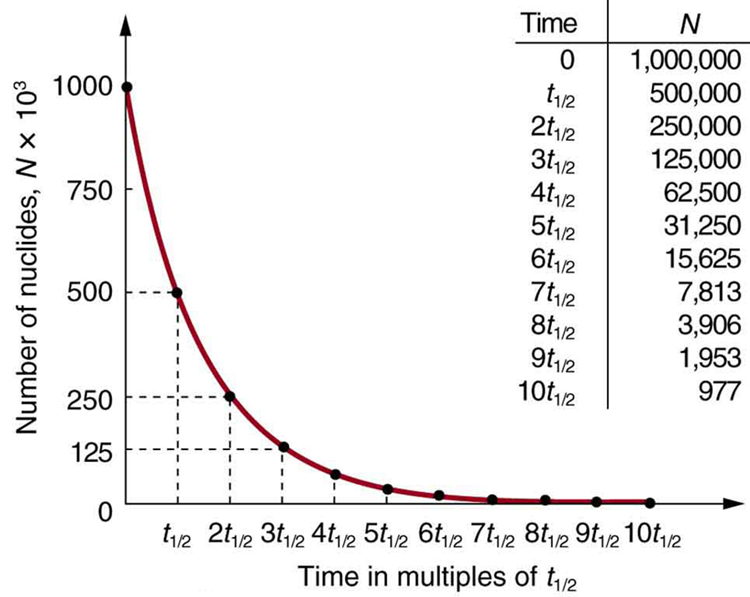
Why use a term like half-life rather than lifetime? The answer can be found by examining [link] , which shows how the number of radioactive nuclei in a sample decreases with time. The time in which half of the original number of nuclei decay is defined as the half-life    , t 1 / 2 size 12{t rSub { size 8{1/2} } } {} . Half of the remaining nuclei decay in the next half-life. Further, half of that amount decays in the following half-life. Therefore, the number of radioactive nuclei decreases from N size 12{N} {} to N / 2 size 12{N/2} {} in one half-life, then to N / 4 size 12{N/4} {} in the next, and to N / 8 size 12{N/8} {} in the next, and so on. If N size 12{N} {} is a large number, then many half-lives (not just two) pass before all of the nuclei decay. Nuclear decay is an example of a purely statistical process. A more precise definition of half-life is that each nucleus has a 50% chance of living for a time equal to one half-life t 1 / 2 size 12{t rSub { size 8{1/2} } } {} . Thus, if N size 12{N} {} is reasonably large, half of the original nuclei decay in a time of one half-life. If an individual nucleus makes it through that time, it still has a 50% chance of surviving through another half-life. Even if it happens to make it through hundreds of half-lives, it still has a 50% chance of surviving through one more. The probability of decay is the same no matter when you start counting. This is like random coin flipping. The chance of heads is 50%, no matter what has happened before.

The figure shows a radioactive decay graph of number of nuclides in thousands versus time in multiples of half-life. The number of radioactive nuclei decreases exponentially and finally approaches zero after about ten half-lives.
Radioactive decay reduces the number of radioactive nuclei over time. In one half-life t 1 / 2 size 12{t rSub { size 8{1/2} } } {} , the number decreases to half of its original value. Half of what remains decay in the next half-life, and half of those in the next, and so on. This is an exponential decay, as seen in the graph of the number of nuclei present as a function of time.

There is a tremendous range in the half-lives of various nuclides, from as short as 10 23 size 12{"10" rSup { size 8{ - "23"} } } {} s for the most unstable, to more than 10 16 size 12{"10" rSup { size 8{"16"} } } {} y for the least unstable, or about 46 orders of magnitude. Nuclides with the shortest half-lives are those for which the nuclear forces are least attractive, an indication of the extent to which the nuclear force can depend on the particular combination of neutrons and protons. The concept of half-life is applicable to other subatomic particles, as will be discussed in Particle Physics . It is also applicable to the decay of excited states in atoms and nuclei. The following equation gives the quantitative relationship between the original number of nuclei present at time zero ( N 0 size 12{N rSub { size 8{0} } } {} ) and the number ( N size 12{N} {} ) at a later time t size 12{t} {} :

N = N 0 e λt , size 12{N=N rSub { size 8{0} } e rSup { size 8{ - λt} } } {}

where e = 2.71828 ... size 12{e=2 "." "71828" "." "." "." } {} is the base of the natural logarithm, and λ size 12{λ} {} is the decay constant    for the nuclide. The shorter the half-life, the larger is the value of λ size 12{λ} {} , and the faster the exponential e λt size 12{e rSup { size 8{ - λt} } } {} decreases with time. The relationship between the decay constant λ size 12{λ} {} and the half-life t 1 / 2 size 12{t rSub { size 8{1/2} } } {} is

Questions & Answers

how do you get the 2/50
Abba Reply
number of sport play by 50 student construct discrete data
Aminu Reply
width of the frangebany leaves on how to write a introduction
Theresa Reply
Solve the mean of variance
Veronica Reply
Step 1: Find the mean. To find the mean, add up all the scores, then divide them by the number of scores. ... Step 2: Find each score's deviation from the mean. ... Step 3: Square each deviation from the mean. ... Step 4: Find the sum of squares. ... Step 5: Divide the sum of squares by n – 1 or N.
kenneth
what is error
Yakuba Reply
Is mistake done to something
Vutshila
Hy
anas
hy
What is the life teble
anas
hy
Jibrin
statistics is the analyzing of data
Tajudeen Reply
what is statics?
Zelalem Reply
how do you calculate mean
Gloria Reply
diveving the sum if all values
Shaynaynay
let A1,A2 and A3 events be independent,show that (A1)^c, (A2)^c and (A3)^c are independent?
Fisaye Reply
what is statistics
Akhisani Reply
data collected all over the world
Shaynaynay
construct a less than and more than table
Imad Reply
The sample of 16 students is taken. The average age in the sample was 22 years with astandard deviation of 6 years. Construct a 95% confidence interval for the age of the population.
Aschalew Reply
Bhartdarshan' is an internet-based travel agency wherein customer can see videos of the cities they plant to visit. The number of hits daily is a normally distributed random variable with a mean of 10,000 and a standard deviation of 2,400 a. what is the probability of getting more than 12,000 hits? b. what is the probability of getting fewer than 9,000 hits?
Akshay Reply
Bhartdarshan'is an internet-based travel agency wherein customer can see videos of the cities they plan to visit. The number of hits daily is a normally distributed random variable with a mean of 10,000 and a standard deviation of 2,400. a. What is the probability of getting more than 12,000 hits
Akshay
1
Bright
Sorry i want to learn more about this question
Bright
Someone help
Bright
a= 0.20233 b=0.3384
Sufiyan
a
Shaynaynay
How do I interpret level of significance?
Mohd Reply
It depends on your business problem or in Machine Learning you could use ROC- AUC cruve to decide the threshold value
Shivam
how skewness and kurtosis are used in statistics
Owen Reply
yes what is it
Taneeya
Got questions? Join the online conversation and get instant answers!
Jobilize.com Reply
Practice Key Terms 8

Get Jobilize Job Search Mobile App in your pocket Now!

Get it on Google Play Download on the App Store Now


Source:  OpenStax, College physics. OpenStax CNX. Jul 27, 2015 Download for free at http://legacy.cnx.org/content/col11406/1.9
Google Play and the Google Play logo are trademarks of Google Inc.

Notification Switch

Would you like to follow the 'College physics' conversation and receive update notifications?

Ask