

| << Chapter < Page | Chapter >> Page > |
Study a synoptic weather chart with its key.
Above the key is an example of a weather station.

Weather station of the chart key
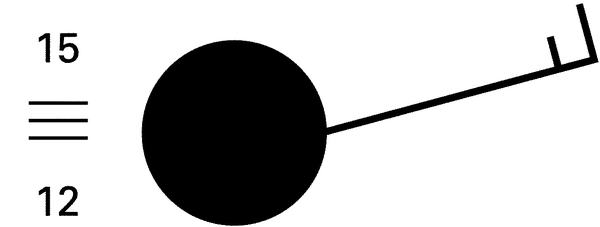
A hypothetical weather station
Figure 2
Each weather station is indicated by means of a circle (O) on a synoptic weather chart. On the right below the circle the name of the weather station is indicated, e.g. Durban. To the left of the circle are two figures. The top one (TT) indicates the air temperature (15 ºC). The bottom one (Td) Td) indicates the dew point temperature (12 ºC). The closer the two figures are to each other, the greater is the chance of precipitation.
To the left of the weather station (ww) the possible form of precipitation that is expected is indicated (Ξ). The key explains the various symbols as follows:

Figure 3
These are indicated only if one of the conditions occur; otherwise they are completely omitted.

Figure 4
Some weather stations also have a line protruding on the side. This indicates the direction in which the wind is blowing. The arrow moves with the wind. The wind direction in figure 2(a) will therefore be southeast, and the one in figure 2(b) will be northeast. If there is no line, there is no wind. At the end of the line indicating the wind direction there are sometimes “feathers” or short lines. These indicate the wind speed. Each full line indicates a speed of 10 knots. Each half line indicates 5 knots. A knot is a speed of 1,85 km/h.
In figure 2(a) the wind speed is therefore 20 knots and in figure 2(b) the speed is 15 knots. If the wind speed is less than 5 knots, there will be only a line indicating the direction, but no “feather” or arrow.
A weather station also indicates the amount of cloud cover. Suppose a quarter of the sky is covered in clouds, then a quarter of the circle will be shaded, like in figure 4.
Weather stations forecast cloud cover in eighths.

Figure 5
A synoptic weather chart also often contains a curve with black triangles or black semi-circles on it. This is called a front, indicating the separation between two different air masses – cold on the one side and warm on the other. In South Africa we mainly have cold fronts.
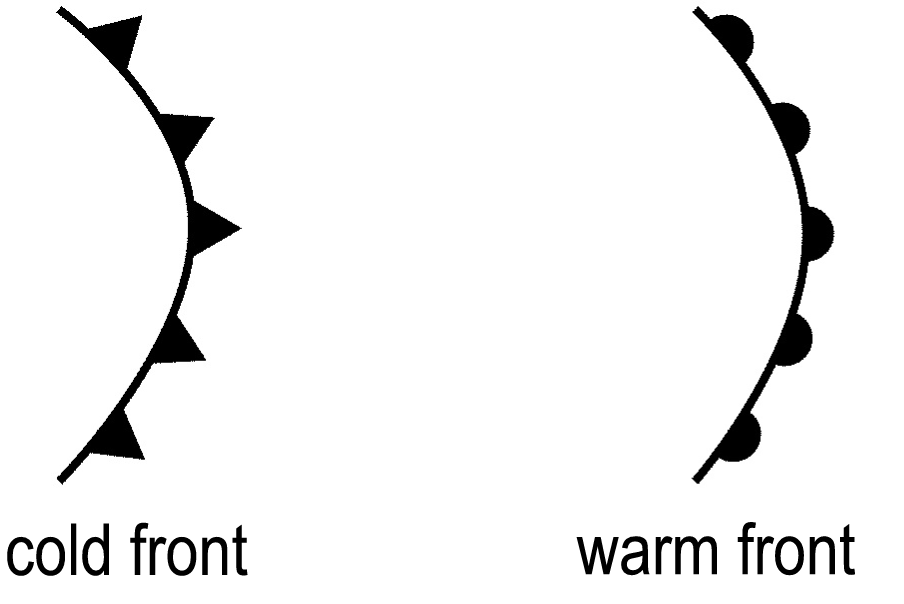
Figure 6
Cold fronts always move from the west in a more or less easterly direction across South Africa. Where the cold air behind the cold front reaches the warm air in front of it, storms and rain usually occur.
The synoptic weather chart always contains fine dotted lines over the sea. These are called isobars and are lines that connect all places with the same air-pressure. Numbers like 1020 and 1022 are shown at intervals on these isobars. This indicates that the air-pressure along the specific isobar is, for example, 1020 hectoPascal (hPa).
These isobars change and move all the time as an air mass moves from a high-pressure to a low-pressure area. A high-pressure cell is indicated with an H and a low-pressure cell with an L.
Activity 2:
To study the synoptic chart and answer the questions that follow
[LO 1.2]
Study the Bloemfontein and Port Elizabeth weather stations and indicate the weather properties for each in the table below.
| Bloemfontein | Weather properties | Port Elizabeth |
| Air temperature | ||
| Dew point temperature | ||
| Wind direction | ||
| Wind speed | ||
| Cloud cover | ||
| Precipitation |
Compare the weather for the two cities and give a basic weather forecast for each.
What is the wind direction and wind speed at Gough Island in the southwestern corner of the map?
Wind direction at Gough Island is_______________________________
Wind speed at Gough Island is_________________________________
How do you know that a cold front is coming?
In what direction do cold fronts move in South Africa?
What type of weather will this cause across the country?
Assessment
| Learning Outcomes(LOs) |
| LO 1 |
| GEOGRAPHICAL ENQUIRYThe learner will be able to use enquiry skills to investigate geographical and environmental concepts and processes. |
| Assessment standards(ASe) |
| We know this when the learner: |
| identifies sources of information, including simple statistics, to help answer the question about a social or environmental issue or problem;selects and records relevant information from sources for specific purposes (including recording and observing in the field);reports on enquiries, through discussion, debate, structured writing, graphs, tables, maps and diagrams. |
| LO 2 |
| GEOGRAPHICAL KNOWLEDGE AND UNDERSTANDINGThe learner will be able to demonstrate an environmental knowledge and understanding. |
| We know this when the learner: |
| explains why more people live in some places than others;identifies how access to different kinds of resources influences development in different places;describes some ways in which society has changed the environment. |
| LO 3 |
| EXPLORING ISSUESThe learner will be able to make informed decisions about social and environmental issues and problems. |
| We know this when the learner: |
| identifies inequalities within and between societies;analyses some of the factors that lead toward social and environmental inequality at different geographical scales and in different places;evaluates actions that lead to the sharing of resources and reducing poverty in a particular context. |
Memorandum
Activity 2:
| Bloemfontein | Weather properties | Port Elizabeth |
| 21 | Air temperature | 17 |
| 2 | Dew point temperature | 13 |
| NE | Wind direction | NE |
| 5 | Wind speed | 10 |
| none | Cloud cover | 100% Overcast |
| none | Precipitation | Good chance |
Notification Switch
Would you like to follow the 'Geography grade 6' conversation and receive update notifications?

|
|

|
|

|
|

|
|

|
|

|
|

|
|
|
|
|

|
|

|