This module introduces tree diagrams as a method for making some probability problems easier to solve. This module is included in the Elementary Statistics textbook/collection as an optional lesson.
A
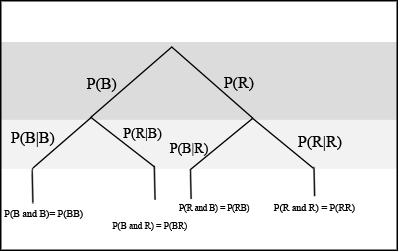
tree diagram is a special type of graph used to determine the outcomes of an experiment. It consists of "branches" that are labeled with either frequencies or probabilities. Tree diagrams can make some probability problems easier to visualize and solve. The following example illustrates how to use a tree diagram.
In an urn, there are 11 balls. Three balls are red (
) and 8 balls are blue (
). Draw two balls, one at a time,
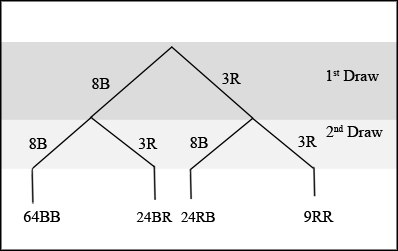
with replacement . "With replacement" means that you put the first ball back in the urn before you select the second ball. The tree diagram using frequencies that show all the possible outcomes follows.
The first set of branches represents the first draw. The second set of branches represents the second draw. Each of the outcomes is distinct. In fact, we can list each red ball as
,
, and
and each blue ball as
,
,
,
,
,
,
, and
. Then the 9
outcomes can be written as:
The other outcomes are similar.
There are a total of 11 balls in the urn. Draw two balls, one at a time, and with replacement. There are
outcomes, the size of the
sample space .
This problem is a conditional. The sample space has been reduced to those outcomes that already have a blue on the first draw. There are
possible outcomes (24
and 64
). Twenty-four of the 88 possible outcomes are
.
.
There are
outcomes that have
on the first draw (9
and 24
). The sample space is then
. Twenty-four of the 33 outcomes have
on the second draw. The probability is then
.
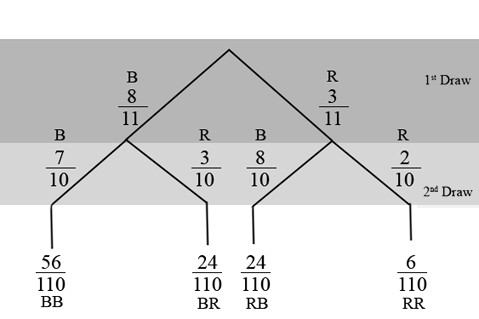
An urn has 3 red marbles and 8 blue marbles in it. Draw two marbles, one at a time, this time without replacement from the urn.
"Without replacement" means that you do not put the first ball back before you select the second ball. Below is a tree diagram. The branches are labeled with probabilities instead of frequencies. The numbers at the ends of the branches are calculated by multiplying the numbers on the two corresponding branches, for example,
.
If you draw a red on the first draw from the 3 red possibilities, there are 2 red left to draw on the second draw. You do not put back or replace the first ball after you have drawn it. You draw
without replacement , so that on the second draw there are 10 marbles left in the urn.
Calculate the following probabilities using the tree diagram.
There are
outcomes that have
on the first draw (6
and 24
). The 6 and the 24 are frequencies. They are also the numerators of the fractions
and
. The sample space is no longer 110 but
. Twenty-four of the 30 outcomes have
on the second draw. The probability is then
. Did you get this answer?
In economics, a perfect market refers to a theoretical construct where all participants have perfect information, goods are homogenous, there are no barriers to entry or exit, and prices are determined solely by supply and demand. It's an idealized model used for analysis,
When MP₁ becomes negative, TP start to decline.
Extuples Suppose that the short-run production function of certain cut-flower firm is given by: Q=4KL-0.6K2 - 0.112 •
Where is quantity of cut flower produced, I is labour input and K is fixed capital input (K-5). Determine the average product of lab
Kelo
Extuples Suppose that the short-run production function of certain cut-flower firm is given by: Q=4KL-0.6K2 - 0.112 •
Where is quantity of cut flower produced, I is labour input and K is fixed capital input (K-5). Determine the average product of labour (APL) and marginal product of labour (MPL)
Quantity demanded refers to the specific amount of a good or service that consumers are willing and able to purchase at a give price and within a specific time period. Demand, on the other hand, is a broader concept that encompasses the entire relationship between price and quantity demanded
Ezea
ok
Shukri
how do you save a country economic situation when it's falling apart
Economic growth as an increase in the production and consumption of goods and services within an economy.but
Economic development as a broader concept that encompasses not only economic growth but also social & human well being.
Shukri
production function means
Jabir
What do you think is more important to focus on when considering inequality ?
sir...I just want to ask one question... Define the term contract curve? if you are free please help me to find this answer 🙏
Asui
it is a curve that we get after connecting the pareto optimal combinations of two consumers after their mutually beneficial trade offs
Awais
thank you so much 👍 sir
Asui
In economics, the contract curve refers to the set of points in an Edgeworth box diagram where both parties involved in a trade cannot be made better off without making one of them worse off. It represents the Pareto efficient allocations of goods between two individuals or entities, where neither p
Cornelius
In economics, the contract curve refers to the set of points in an Edgeworth box diagram where both parties involved in a trade cannot be made better off without making one of them worse off. It represents the Pareto efficient allocations of goods between two individuals or entities,
Cornelius
Suppose a consumer consuming two commodities X and Y has
The following utility function u=X0.4 Y0.6. If the price of the X and Y are 2 and 3 respectively and income Constraint is birr 50.
A,Calculate quantities of x and y which maximize utility.
B,Calculate value of Lagrange multiplier.
C,Calculate quantities of X and Y consumed with a given price.
D,alculate optimum level of output .
the market for lemon has 10 potential consumers, each having an individual demand curve p=101-10Qi, where p is price in dollar's per cup and Qi is the number of cups demanded per week by the i th consumer.Find the market demand curve using algebra. Draw an individual demand curve and the market dema
suppose the production function is given by ( L, K)=L¼K¾.assuming capital is fixed find APL and MPL. consider the following short run production function:Q=6L²-0.4L³ a) find the value of L that maximizes output b)find the value of L that maximizes marginal product