<< Chapter < Page Chapter >> Page >
Basic curve fitting and linear regression.

RegressionAnalysis

What is regression analysis?

Suppose we calculate some variable of interest, y, as a function of some other variable x. We call y the dependent variable and x the independent variable. For example, consider the data set below, taken from a simple experiment involving a vehicle, its velocity versus time is tabulated. In this case, velocity is a function of time, thus velocity is the dependent variable and the time is the independent variable.

Vehicle velocity versus time.
Time [s] Velocity [m/s]
0 20
10 39
20 67
30 89
40 111
50 134
60 164
70 180
80 200

In its simplest form regression analysis involves fitting the best straight line relationship to explain how the variation in a dependent variable, y, depends on the variation in an independent variable, x. In our example above, once the relationship (in this case a linear relationship) has been estimated we can produce a linear equation in the following form:

y m x n

And once an analytic equation such as the one above has been determined, dependent variables at intermediate independent values can be computed.

Performing linear regression

Regression analysis with MATLAB is easy. The MATLAB Basic Fitting GUI allows us to interactively to do "curve fitting" which is a method to arrive at the best "straight line" fit for linear equations or the best curve fit for a polynomial up to the tenth degree. The procedure to perform a curve fitting with MATLAB is as follows:

  1. Input the variables,
  2. Plot the data,
  3. Initialize the Basic Fitting GUI,
  4. Select the desired regression analysis parameters.

Using the data set above, determine the relationship between velocity and time.

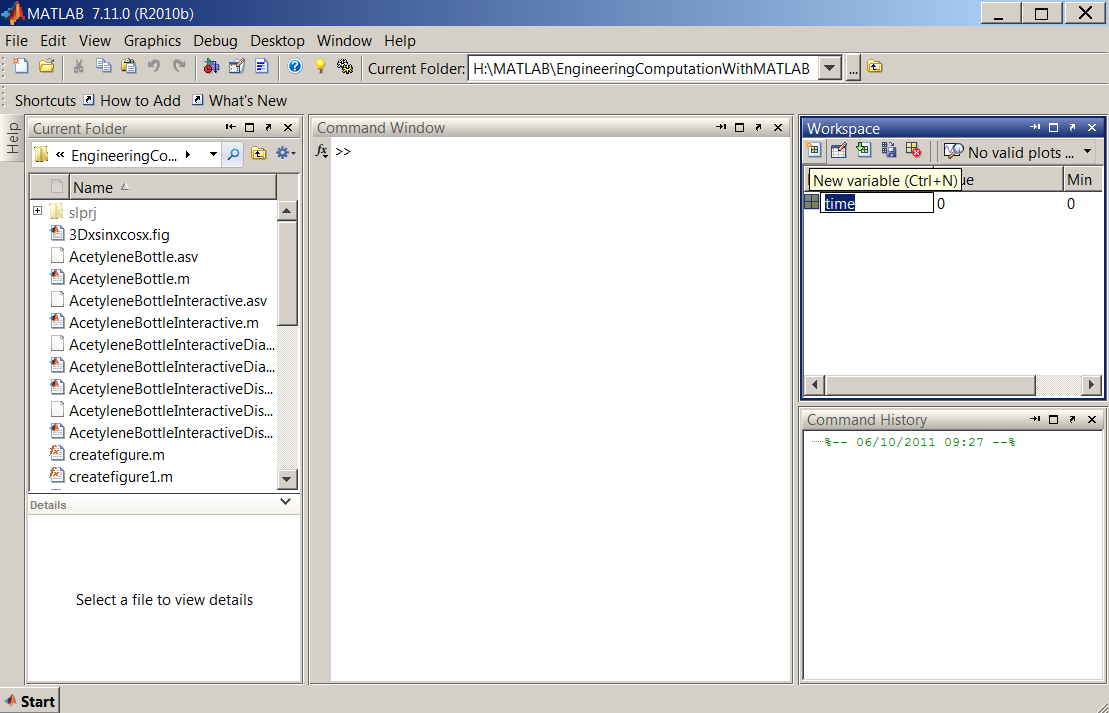
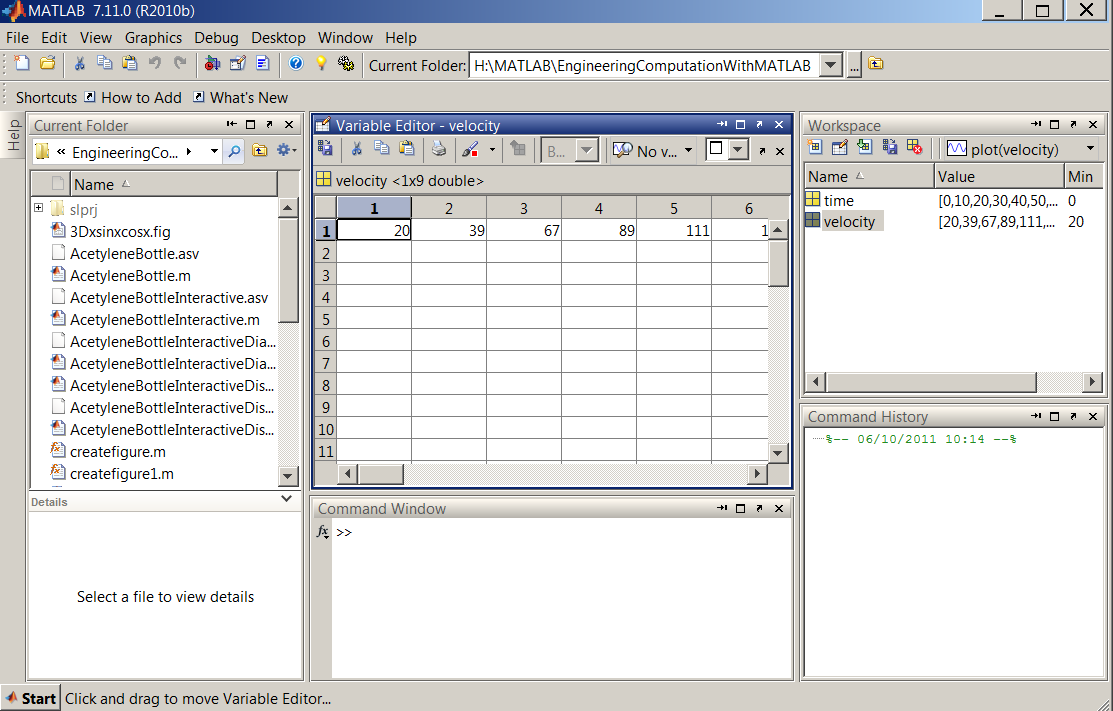
First, let us input the variables (Workspace>New variable) as shown in the following figures.

NewVariable
A new variable is created in the Workspace.

NewVariable
New variables are entered in the Variable Editor.

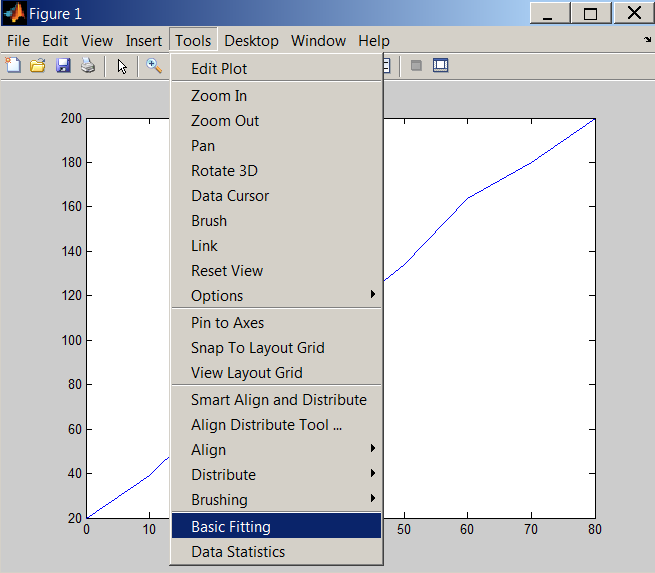
Second, we will plot the data by typing in 
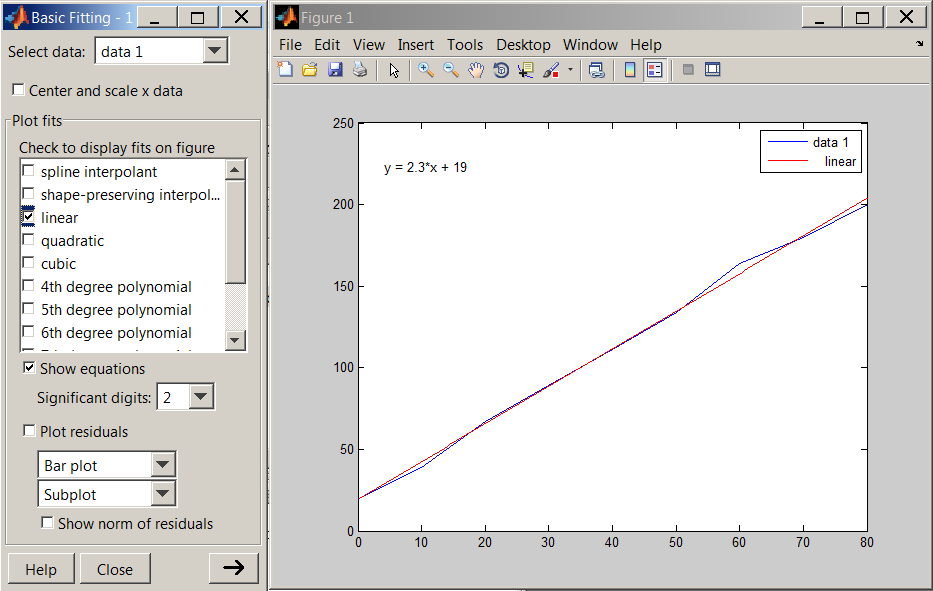
plot(time,velocity) at the MATLAB prompt. The following plot is generated, select Tools>Basic Fitting:

NewVariable
A plot is generated in Figure 1. The Basic Fitting tool can be initialized from Tools>Basic Fitting.

In the "Basic Fitting" window, select "linear" and "Show equations". The best fitting linear line along with the corresponding equation are displayed on the plot:

NewVariable
Basic Fitting window is used to select the desired regression analysis parameters.

Now let us do another curve fitting and obtain an equation for the function. Using that equation, we can evaluate the function at a desired value with polyval .

The following is a collection of data for an iron-constantan thermocouple (data available for download ). Engineering Fundamentals and Problem Solving by Arvid R. Eide, Roland Jenison, Larry L. Northup, Steven K. Mikelson , McGraw-Hill Higher Education. © 2007 p.114

Temperature [C] vs Voltage [mV]
Temperature [C] Voltage [mV]
50 2.6
100 6.7
150 8.8
200 11.2
300 17.0
400 22.5
500 26
600 32.5
700 37.7
800 41
900 48
1000 55.2
  1. Plot a graph with Temperature as the independent variable.
  2. Determine the equation of the relationship using the Basic Fitting tools.
  3. Estimate the Voltage that corresponds to a Temperature of 650 C and 1150 C.

We will input the variables first:

Temp=[50;100;150;200;300;400;500;600;700;800;900;1000] Voltage=[2.6;6.7;8.8;11.2;17;22.5;26;32.5;37.7;41;48;55.2]

To plot the graph, type in:
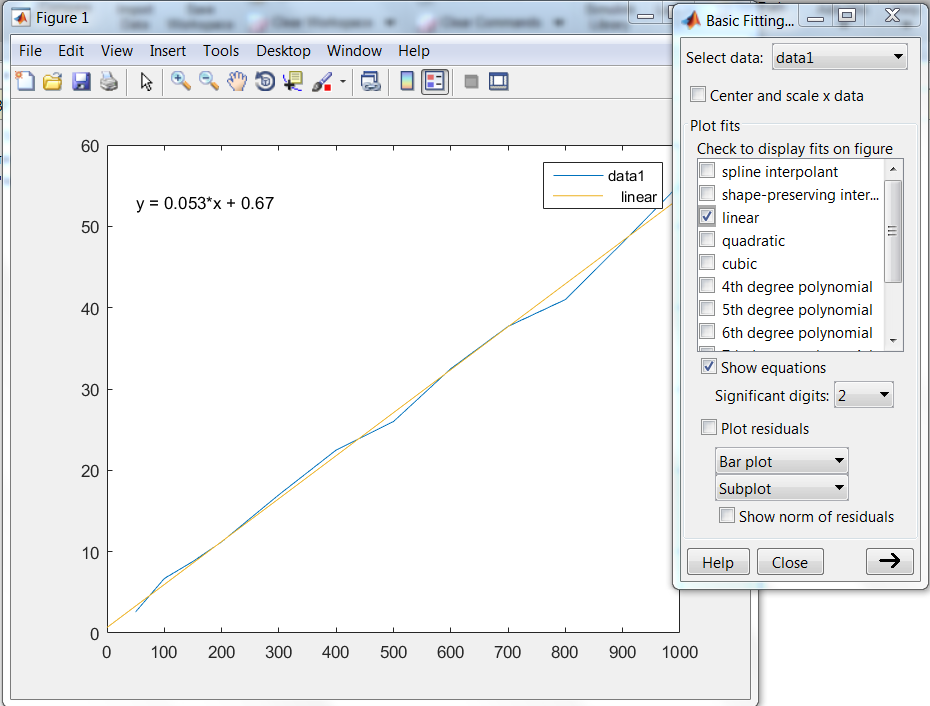
plot(Temp,Voltage)

We can now use the Plot Tools and Basic Fitting settings and determine the equation:

NewVariable
Basic Fitting window is used to select the desired regression analysis parameters.

By clicking the right arrow twice at the bottom right corner on the Basic Fitting window, we can evaluate the function at a desired value. See the figure below which illustrates this process for the temperature value 1150 C.

Evalu
Estimating the Voltage that corresponds to a Temperature of 1150 C.

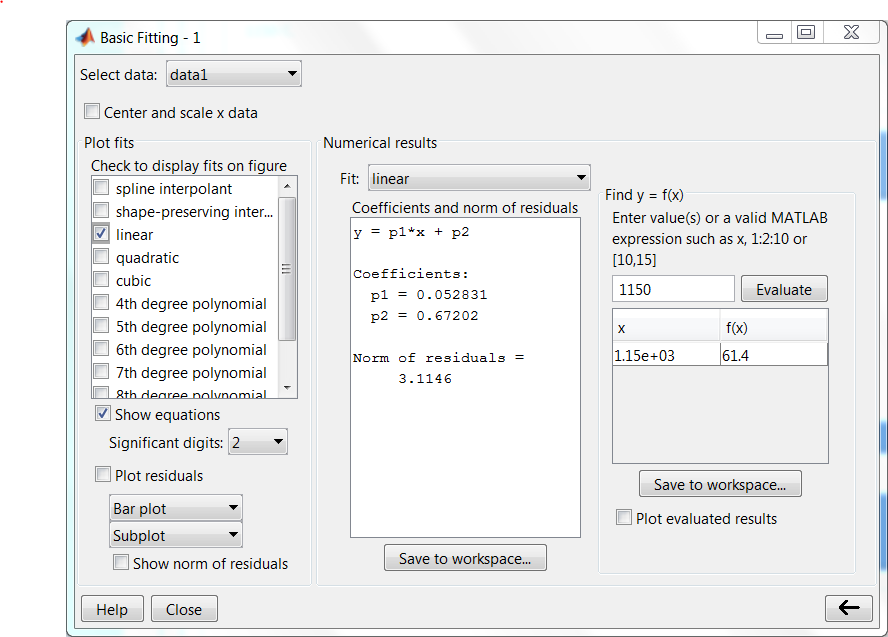
Now let us check our answer with a technique we learned earlier. As displayed on the plot, we have obtained the following equation: y 0.052831 x 0.67202 This equation can be entered as polynomial and evaluated at 650 and 1150 as follows:

>>p=[0.052831,0.67202] p =0.0528 0.6720>>polyval(p,1150) ans =61.4277

Summary of key points

  1. Linear regression involves fitting the best straight line relationship to explain how the variation in a dependent variable, y, depends on the variation in an independent variable, x,
  2. Basic Fitting GUI allows us to interactively perform curve fitting,
  3. Some of the plot fits available are linear, quadratic and cubic functions,
  4. Basic Fitting GUI can evaluate functions at given points.

Questions & Answers

how does Neisseria cause meningitis
Nyibol Reply
what is microbiologist
Muhammad Reply
what is errata
Muhammad
is the branch of biology that deals with the study of microorganisms.
Ntefuni Reply
What is microbiology
Mercy Reply
studies of microbes
Louisiaste
when we takee the specimen which lumbar,spin,
Ziyad Reply
How bacteria create energy to survive?
Muhamad Reply
Bacteria doesn't produce energy they are dependent upon their substrate in case of lack of nutrients they are able to make spores which helps them to sustain in harsh environments
_Adnan
But not all bacteria make spores, l mean Eukaryotic cells have Mitochondria which acts as powerhouse for them, since bacteria don't have it, what is the substitution for it?
Muhamad
they make spores
Louisiaste
what is sporadic nd endemic, epidemic
Aminu Reply
the significance of food webs for disease transmission
Abreham
food webs brings about an infection as an individual depends on number of diseased foods or carriers dully.
Mark
explain assimilatory nitrate reduction
Esinniobiwa Reply
Assimilatory nitrate reduction is a process that occurs in some microorganisms, such as bacteria and archaea, in which nitrate (NO3-) is reduced to nitrite (NO2-), and then further reduced to ammonia (NH3).
Elkana
This process is called assimilatory nitrate reduction because the nitrogen that is produced is incorporated in the cells of microorganisms where it can be used in the synthesis of amino acids and other nitrogen products
Elkana
Examples of thermophilic organisms
Shu Reply
Give Examples of thermophilic organisms
Shu
advantages of normal Flora to the host
Micheal Reply
Prevent foreign microbes to the host
Abubakar
they provide healthier benefits to their hosts
ayesha
They are friends to host only when Host immune system is strong and become enemies when the host immune system is weakened . very bad relationship!
Mark
what is cell
faisal Reply
cell is the smallest unit of life
Fauziya
cell is the smallest unit of life
Akanni
ok
Innocent
cell is the structural and functional unit of life
Hasan
is the fundamental units of Life
Musa
what are emergency diseases
Micheal Reply
There are nothing like emergency disease but there are some common medical emergency which can occur simultaneously like Bleeding,heart attack,Breathing difficulties,severe pain heart stock.Hope you will get my point .Have a nice day ❣️
_Adnan
define infection ,prevention and control
Innocent
I think infection prevention and control is the avoidance of all things we do that gives out break of infections and promotion of health practices that promote life
Lubega
Heyy Lubega hussein where are u from?
_Adnan
en français
Adama
which site have a normal flora
ESTHER Reply
Many sites of the body have it Skin Nasal cavity Oral cavity Gastro intestinal tract
Safaa
skin
Asiina
skin,Oral,Nasal,GIt
Sadik
How can Commensal can Bacteria change into pathogen?
Sadik
How can Commensal Bacteria change into pathogen?
Sadik
all
Tesfaye
by fussion
Asiina
what are the advantages of normal Flora to the host
Micheal
what are the ways of control and prevention of nosocomial infection in the hospital
Micheal
what is inflammation
Shelly Reply
part of a tissue or an organ being wounded or bruised.
Wilfred
what term is used to name and classify microorganisms?
Micheal Reply
Binomial nomenclature
adeolu
Got questions? Join the online conversation and get instant answers!
Jobilize.com Reply

Get Jobilize Job Search Mobile App in your pocket Now!

Get it on Google Play Download on the App Store Now


Source:  OpenStax, A brief introduction to engineering computation with matlab. OpenStax CNX. Nov 17, 2015 Download for free at http://legacy.cnx.org/content/col11371/1.11
Google Play and the Google Play logo are trademarks of Google Inc.

Notification Switch

Would you like to follow the 'A brief introduction to engineering computation with matlab' conversation and receive update notifications?

Ask