| << Chapter < Page | Chapter >> Page > |
The body of the method named f4 is similar to the body of the method named f3 , except that f4 computes and returns sine values instead of cosine values. Also, the value of x is used differently so that the period of the curve produced by f4 is twice the period of the curve produced by f3 .
Finally, the bottom white plotting area in Figure 1 shows the output produced by the method named f5 , which is shown in Listing 8 .
| Listing 8. The method named f5. |
|---|
public double f5(double x){
return 100*(Math.sin(x/20.0)*Math.cos(x/10.0));}//end f5 |
This method computes and returns the product of sine and cosine functions identical to those discussed above.
Listing 8 also shows the closing curly brace that signifies the end of the class definition for the class named Graph01Demo .
That's really all that you need to know to be able to make effective use of the generalized plotting program named Graph01 . If you can define the methods named f1 through f5 , which will return the required values for your computational experiment, then you canmake use of this program to plot your data.
Lest you go away believing that this is all too trivial to be interesting, I am going to show you another example that is far from trivial. In the nextexample, I will demonstrate two of the most important operations in the field commonly referred to as digital signal processing, or DSP for short.
Because many of you are unlikely to be familiar with the techniques and terminology involved, the discussion will of necessity be fairly shallow.However, I do want to show at least one example of how you can perform substantive computational experiments using this approach.
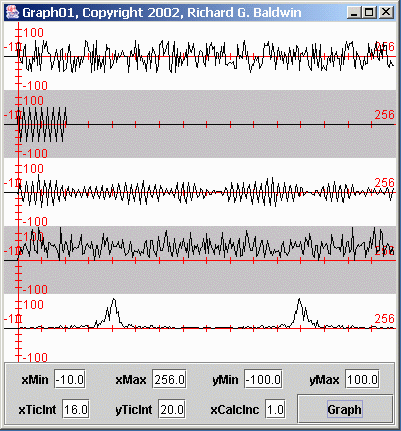
A DSP example involving convolution filtering and spectral analysis is shown in Figure 3 .
| Figure 3. A Digital Signal Processing (DSP) Example. |
|---|
 |
In the field of DSP, the five individual plots shown in the plotting areas of Figure 3 are commonly referred to as traces. I will use that terminology in this discussion.
The top trace in the area with the white background shows about 256 samples of white random noise. When we get to the code, we will see that this data wascreated using a Java pseudo-random number generator.
The second trace from the top shows a 33-point narrow-band convolution filter, which is simply a chunk taken out of a sinusoid whose frequency isone-fourth the sampling frequency. In other words, the sinusoid is represented by four samples per cycle.
The middle trace shows the result of applying the narrow-band convolution filter to the white noise. The output from the convolution process was amplifiedto bring it back into an appropriate amplitude range for visual analysis.
If you compare the middle trace with the top trace, you will notice that much of the high-frequency energy and much of the low-frequency energy has beenremoved. Most of the energy in the middle trace appears to be about the same frequency as the design frequency of the convolution filter (which is what we would expect) .

Notification Switch
Would you like to follow the 'Digital signal processing - dsp' conversation and receive update notifications?