<< Chapter < Page Chapter >> Page >

Farmer’s market

This is a photograph of various organic vegetables in baskets at a farmer's market.
Organic vegetables and fruits that are grown and sold within a specific geographical region should, in theory, cost less than conventional produce because the transportation costs are less. That is not, however, usually the case. (Credit: modification of work by Natalie Maynor/Flickr Creative Commons)

Why can we not get enough of organic?

Organic food is increasingly popular, not just in the United States, but worldwide. At one time, consumers had to go to specialty stores or farmer’s markets to find organic produce. Now it is available in most grocery stores. In short, organic is part of the mainstream.

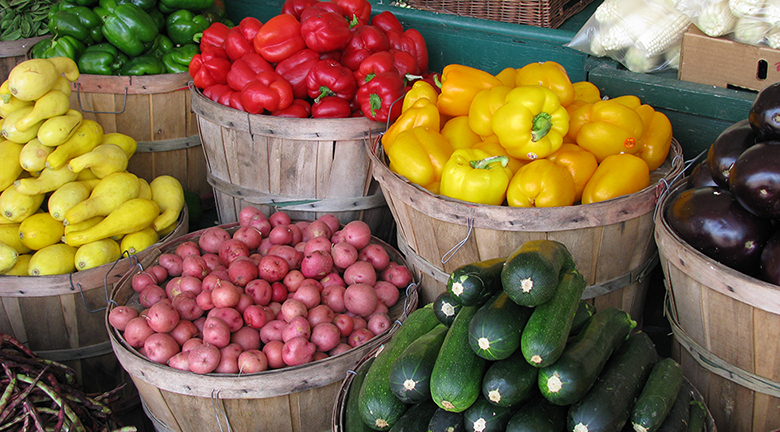
Ever wonder why organic food costs more than conventional food? Why, say, does an organic Fuji apple cost $1.99 a pound, while its conventional counterpart costs $1.49 a pound? The same price relationship is true for just about every organic product on the market. If many organic foods are locally grown, would they not take less time to get to market and therefore be cheaper? What are the forces that keep those prices from coming down? Turns out those forces have a lot to do with this chapter’s topic: demand and supply.

Introduction to demand and supply

In this chapter, you will learn about:

  • Demand, Supply, and Equilibrium in Markets for Goods and Services
  • Shifts in Demand and Supply for Goods and Services
  • Changes in Equilibrium Price and Quantity: The Four-Step Process
  • Price Ceilings and Price Floors

An auction bidder pays thousands of dollars for a dress Whitney Houston wore. A collector spends a small fortune for a few drawings by John Lennon. People usually react to purchases like these in two ways: their jaw drops because they think these are high prices to pay for such goods or they think these are rare, desirable items and the amount paid seems right.

Visit this website to read a list of bizarre items that have been purchased for their ties to celebrities. These examples represent an interesting facet of demand and supply.

When economists talk about prices, they are less interested in making judgments than in gaining a practical understanding of what determines prices and why prices change. Consider a price most of us contend with weekly: that of a gallon of gas. Why was the average price of gasoline in the United States $3.71 per gallon in June 2014? Why did the price for gasoline fall sharply to $2.07 per gallon by January 2015? To explain these price movements, economists focus on the determinants of what gasoline buyers are willing to pay and what gasoline sellers are willing to accept.

As it turns out, the price of gasoline in June of any given year is nearly always higher than the price in January of that same year; over recent decades, gasoline prices in midsummer have averaged about 10 cents per gallon more than their midwinter low. The likely reason is that people drive more in the summer, and are also willing to pay more for gas, but that does not explain how steeply gas prices fell. Other factors were at work during those six months, such as increases in supply and decreases in the demand for crude oil.

This chapter introduces the economic model of demand and supply—one of the most powerful models in all of economics. The discussion here begins by examining how demand and supply determine the price and the quantity sold in markets for goods and services, and how changes in demand and supply lead to changes in prices and quantities.

Questions & Answers

how do you get the 2/50
Abba Reply
number of sport play by 50 student construct discrete data
Aminu Reply
width of the frangebany leaves on how to write a introduction
Theresa Reply
Solve the mean of variance
Veronica Reply
Step 1: Find the mean. To find the mean, add up all the scores, then divide them by the number of scores. ... Step 2: Find each score's deviation from the mean. ... Step 3: Square each deviation from the mean. ... Step 4: Find the sum of squares. ... Step 5: Divide the sum of squares by n – 1 or N.
kenneth
what is error
Yakuba Reply
Is mistake done to something
Vutshila
Hy
anas
hy
What is the life teble
anas
hy
Jibrin
statistics is the analyzing of data
Tajudeen Reply
what is statics?
Zelalem Reply
how do you calculate mean
Gloria Reply
diveving the sum if all values
Shaynaynay
let A1,A2 and A3 events be independent,show that (A1)^c, (A2)^c and (A3)^c are independent?
Fisaye Reply
what is statistics
Akhisani Reply
data collected all over the world
Shaynaynay
construct a less than and more than table
Imad Reply
The sample of 16 students is taken. The average age in the sample was 22 years with astandard deviation of 6 years. Construct a 95% confidence interval for the age of the population.
Aschalew Reply
Bhartdarshan' is an internet-based travel agency wherein customer can see videos of the cities they plant to visit. The number of hits daily is a normally distributed random variable with a mean of 10,000 and a standard deviation of 2,400 a. what is the probability of getting more than 12,000 hits? b. what is the probability of getting fewer than 9,000 hits?
Akshay Reply
Bhartdarshan'is an internet-based travel agency wherein customer can see videos of the cities they plan to visit. The number of hits daily is a normally distributed random variable with a mean of 10,000 and a standard deviation of 2,400. a. What is the probability of getting more than 12,000 hits
Akshay
1
Bright
Sorry i want to learn more about this question
Bright
Someone help
Bright
a= 0.20233 b=0.3384
Sufiyan
a
Shaynaynay
How do I interpret level of significance?
Mohd Reply
It depends on your business problem or in Machine Learning you could use ROC- AUC cruve to decide the threshold value
Shivam
how skewness and kurtosis are used in statistics
Owen Reply
yes what is it
Taneeya
Got questions? Join the online conversation and get instant answers!
Jobilize.com Reply

Get Jobilize Job Search Mobile App in your pocket Now!

Get it on Google Play Download on the App Store Now


Source:  OpenStax, Principles of economics. OpenStax CNX. Sep 19, 2014 Download for free at http://legacy.cnx.org/content/col11613/1.11
Google Play and the Google Play logo are trademarks of Google Inc.

Notification Switch

Would you like to follow the 'Principles of economics' conversation and receive update notifications?

Ask