| << Chapter < Page | Chapter >> Page > |
Step-By-Step Example of a Hypothesis Test for a Single Mean, Sigma Known (used Ex XX)
Suppose a baker claims that his bread height is more than 15 cm, on the average. Several of his customers do not believe him. To persuade his customers that he is right, the baker decides to do a hypothesis test. He randomly bakes 10 loaves of bread. The mean height of the sample loaves is 15.7 cm. The baker knows from baking hundreds of loaves of bread that the standard deviation for the height is 1 cm. and the distribution of heights is normal. Test at the 5% significance level.
| State the question: State what we want to determine and what level of significance is important in your decision. | We are asked to test the hypothesis that the mean bread height, μ, is more than 15 cm. We have a sample of 10 loaves. We know the population standard deviation is 1. Significance level is 5%. |
Plan: Based on the above question(s) and the answer to the following questions, decide which test you will be performing.
|
We have univariate, quantitative data. We have a sample of 10 loaves. We know the population standard deviation is 1. Therefore, we can perform a z-test (known population standard deviation). Our model will be:
|
Hypotheses: State the null and alternative hypotheses in words then in symbolic form
|
Null hypothesis in words: The null hypothesis is that the true mean height of the loaves is equal to 15 cm. Null Hypothesis symbolically: : μ = 15 Alternative Hypothesis in words: The alternative is that the true mean height on average is greater than 15 cm. Alternative Hypothesis symbolically: : μ>15 |
| The criteria for the inferential test stated above: Think about the assumptions and check the conditions. Summary statistics to support assumptions: If your assumptions include the need for particular types of data distribution, please indicate here and insert the appropriate graphs or charts. |
Randomization Condition: The sample is a random sample.
|
| Compute the test statistics: State the parameters and the sampling model | The conditions are satisfied and σ is known, so we will use a hypothesis test for a mean with known standard deviation. For this calculation,we need the sample mean and standard error (SE).
|
| Determine the Critical Region(s): Based on your hypotheses are you performing a left-tailed, right tailed or two-tailed test? | I will perform a right tailed test. I am only concerned about the bread being higher than 15 cm. |
| Sketch the test statistic and critical region: . Look up the probability on the table. |
|
|
Determine the P-value |
P(z<2.2134) = 0.9838; P(z>2.214) = 1-0.9838 = 0.0162 |
|
State whether you reject or fail to reject the Null hypothesis. |
Since the probability is less than 2%, this is considered a rare event and the small probability leads us to reject the null hypothesis. |
| Conclusion: Interpret your result in the proper context, and relate it to the original question. | Since the probability is less than 2%, this is considered a rare event and the small probability leads us to reject the null hypothesis. It is unlikely that a loaf of bread rises no more than 15 cm, on the average. That is, less than 2% of all loaves of bread would be at least as high as the outcome of 15.7 cm. purely by chance had the population mean height really been 15 cm. We conclude that the evidence is against the null hypothesis (the mean height is 15 cm.). There is sufficient evidence that the true mean height for the population of the baker’s loaves is greater than 15 cm. |
|
If you reject the null hypothesis, continue to complete the following |
|
|
Calculate and display your confidence interval for the Alternative hypothesis. |
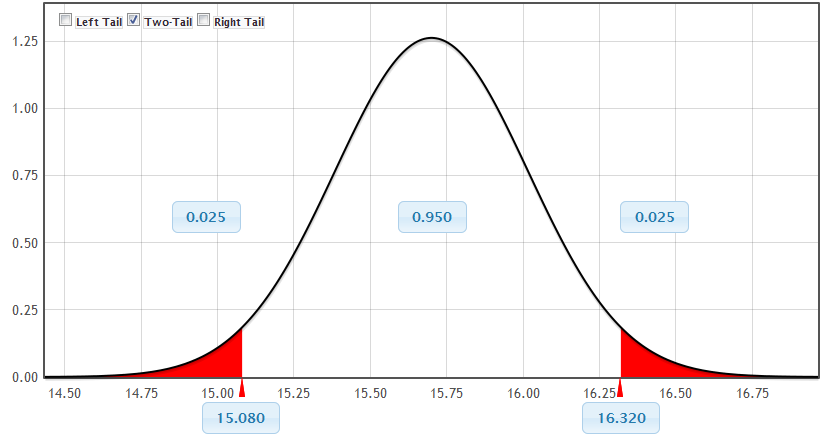
The mathematics for the confidence interval uses 15.7 as the mean bread height and 0.3162 as the SE. We graph a two tailed confidence interval.
z-score for a two tailed test with 95% confidence is plus or minus 1.96 (read from the z-table 0.025 probability in the left tail and 0.025 probability in the right tail)
;
|
|
Conclusion State your conclusion based on your confidence interval. |
We are 95% confident that the true mean of the bakers bread height is greater than 15 cm. We are 95% confident that the population mean height is between 15.08 cm. and 16.32 cm. |
Notification Switch
Would you like to follow the 'Collaborative statistics using spreadsheets' conversation and receive update notifications?

|
|

|
|

|
|
|
|
|

|
|

|
|

|
|

|
|

|
|
|
|