<< Chapter < Page Chapter >> Page >

When using a hypothesis test for matched or paired samples, the following characteristics should be present:

  1. Simple random sampling is used.
  2. Sample sizes are often small.
  3. Two measurements (samples) are drawn from the same pair of individuals or objects.
  4. Differences are calculated from the matched or paired samples.
  5. The differences form the sample that is used for the hypothesis test.
  6. Either the matched pairs have differences that come from a population that is normal or the number of differences is sufficiently large so that distribution of the sample mean of differences is approximately normal.

In a hypothesis test for matched or paired samples, subjects are matched in pairs and differences are calculated. The differences are the data. The population mean for the differences, μ d , is then tested using a Student's-t test for a single population mean with n – 1 degrees of freedom, where n is the number of differences.

The test statistic ( t -score) is:

t = x ¯ d μ d ( s d n )

A study was conducted to investigate the effectiveness of hypnotism in reducing pain. Results for randomly selected subjects are shown in [link] . A lower score indicates less pain. The "before" value is matched to an "after" value and the differences are calculated. The differences have a normal distribution. Are the sensory measurements, on average, lower after hypnotism? Test at a 5% significance level.

Subject: A B C D E F G H
Before 6.6 6.5 9.0 10.3 11.3 8.1 6.3 11.6
After 6.8 2.4 7.4 8.5 8.1 6.1 3.4 2.0

Corresponding "before" and "after" values form matched pairs. (Calculate "after" – "before.")

After Data Before Data Difference
6.8 6.6 0.2
2.4 6.5 -4.1
7.4 9 -1.6
8.5 10.3 -1.8
8.1 11.3 -3.2
6.1 8.1 -2
3.4 6.3 -2.9
2 11.6 -9.6

The data for the test are the differences: {0.2, –4.1, –1.6, –1.8, –3.2, –2, –2.9, –9.6}

The sample mean and sample standard deviation of the differences are: x d = –3.13 and s d = 2.91 Verify these values.

Let μ d be the population mean for the differences. We use the subscript d to denote "differences."

Random variable: X ¯ d = the mean difference of the sensory measurements

H 0 : μ d ≥ 0

The null hypothesis is zero or positive, meaning that there is the same or more pain felt after hypnotism. That means the subject shows no improvement. μ d is the population mean of the differences.)

H a : μ d <0

The alternative hypothesis is negative, meaning there is less pain felt after hypnotism. That means the subject shows improvement. The score should be lower after hypnotism, so the difference ought to be negative to indicate improvement.

Distribution for the test: The distribution is a Student's t with df = n – 1 = 8 – 1 = 7. Use t 7 . (Notice that the test is for a single population mean.)

Calculate the p -value using the Student's-t distribution: p -value = 0.0095

Graph:

Normal distribution curve of the average difference of sensory measurements with values of -3.13 and 0. A vertical upward line extends from -3.13 to the curve, and the p-value is indicated in the area to the left of this value.

X ¯ d 
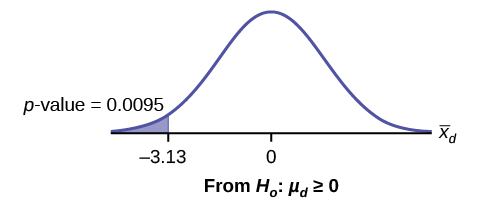
is the random variable for the differences.

The sample mean and sample standard deviation of the differences are:

x ¯ d = –3.13

s ¯ d = 2.91

Compare α and the p -value: α = 0.05 and p -value = 0.0095. α > p -value.

Make a decision: Since α > p -value, reject H 0 . This means that μ d <0 and there is improvement.

Conclusion: At a 5% level of significance, from the sample data, there is sufficient evidence to conclude that the sensory measurements, on average, are lower after hypnotism. Hypnotism appears to be effective in reducing pain.

Questions & Answers

what is biology
Hajah Reply
the study of living organisms and their interactions with one another and their environments
AI-Robot
what is biology
Victoria Reply
HOW CAN MAN ORGAN FUNCTION
Alfred Reply
the diagram of the digestive system
Assiatu Reply
allimentary cannel
Ogenrwot
How does twins formed
William Reply
They formed in two ways first when one sperm and one egg are splited by mitosis or two sperm and two eggs join together
Oluwatobi
what is genetics
Josephine Reply
Genetics is the study of heredity
Misack
how does twins formed?
Misack
What is manual
Hassan Reply
discuss biological phenomenon and provide pieces of evidence to show that it was responsible for the formation of eukaryotic organelles
Joseph Reply
what is biology
Yousuf Reply
the study of living organisms and their interactions with one another and their environment.
Wine
discuss the biological phenomenon and provide pieces of evidence to show that it was responsible for the formation of eukaryotic organelles in an essay form
Joseph Reply
what is the blood cells
Shaker Reply
list any five characteristics of the blood cells
Shaker
lack electricity and its more savely than electronic microscope because its naturally by using of light
Abdullahi Reply
advantage of electronic microscope is easily and clearly while disadvantage is dangerous because its electronic. advantage of light microscope is savely and naturally by sun while disadvantage is not easily,means its not sharp and not clear
Abdullahi
cell theory state that every organisms composed of one or more cell,cell is the basic unit of life
Abdullahi
is like gone fail us
DENG
cells is the basic structure and functions of all living things
Ramadan
What is classification
ISCONT Reply
is organisms that are similar into groups called tara
Yamosa
in what situation (s) would be the use of a scanning electron microscope be ideal and why?
Kenna Reply
A scanning electron microscope (SEM) is ideal for situations requiring high-resolution imaging of surfaces. It is commonly used in materials science, biology, and geology to examine the topography and composition of samples at a nanoscale level. SEM is particularly useful for studying fine details,
Hilary
cell is the building block of life.
Condoleezza Reply
Got questions? Join the online conversation and get instant answers!
Jobilize.com Reply

Get Jobilize Job Search Mobile App in your pocket Now!

Get it on Google Play Download on the App Store Now


Source:  OpenStax, Statistics i - math1020 - red river college - version 2015 revision a - draft 2015-10-24. OpenStax CNX. Oct 24, 2015 Download for free at http://legacy.cnx.org/content/col11891/1.8
Google Play and the Google Play logo are trademarks of Google Inc.

Notification Switch

Would you like to follow the 'Statistics i - math1020 - red river college - version 2015 revision a - draft 2015-10-24' conversation and receive update notifications?

Ask