

| << Chapter < Page | Chapter >> Page > |
Two types of valves are being tested to determine if there is a difference in pressure tolerances. Fifteen out of a random sample of 100 of Valve A cracked under 4,500 psi. Six out of a random sample of 100 of Valve B cracked under 4,500 psi. Test at a 5% level of significance.
The p -value is 0.0379, so we can reject the null hypothesis. At the 5% significance level, the data support that there is a difference in the pressure tolerances between the two valves.
A research study was conducted about gender differences in “sexting.” The researcher believed that the proportion of girls involved in “sexting” is less than the proportion of boys involved. The data collected in the spring of 2010 among a random sample of middle and high school students in a large school district in the southern United States is summarized in [link] . Is the proportion of girls sending sexts less than the proportion of boys “sexting?” Test at a 1% level of significance.
| Males | Females | |
|---|---|---|
| Sent “sexts” | 183 | 156 |
| Total number surveyed | 2231 | 2169 |
This is a test of two population proportions. Let M and F be the subscripts for males and females. Then p M and p F are the desired population proportions.
H 0 : p F = p M H 0 : p F – p M = 0
H a : p F < p M H a : p F – p M <0
The words "less than" tell you the test is left-tailed.
Distribution for the test: Since this is a test of two population proportions, the distribution is normal:
Therefore,
p′
F –
p′
M follows an approximate normal distribution.
Calculate the
p -value using the normal distribution:
p -value = 0.1045
Estimated proportion for females: 0.0719
Estimated proportion for males: 0.082

Decision: Since α < p -value, Do not reject H 0
Conclusion: At the 1% level of significance, from the sample data, there is not sufficient evidence to conclude that the proportion of girls sending “sexts” is less than the proportion of boys sending “sexts.”
Researchers conducted a study of smartphone use among adults. A cell phone company claimed that iPhone smartphones are more popular with whites (non-Hispanic) than with African Americans. The results of the survey indicate that of the 232 African American cell phone owners randomly sampled, 5% have an iPhone. Of the 1,343 white cell phone owners randomly sampled, 10% own an iPhone. Test at the 5% level of significance. Is the proportion of white iPhone owners greater than the proportion of African American iPhone owners?
This is a test of two population proportions. Let W and A be the subscripts for the whites and African Americans. Then p W and p A are the desired population proportions.
H 0 : p W = p A H 0 : p W – p A = 0
H a : p W > p A H a : p W – p A >0
The words "more popular" indicate that the test is right-tailed.
Distribution for the test: The distribution is approximately normal:
Therefore,
follows an approximate normal distribution.
Graph:
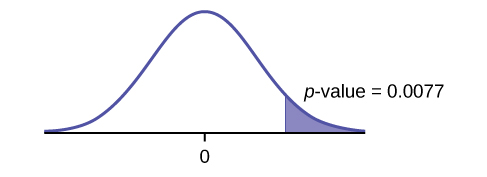
Decision: Since α > p -value, reject the H 0 .
Conclusion: At the 5% level of significance, from the sample data, there is sufficient evidence to conclude that a larger proportion of white cell phone owners use iPhones than African Americans.
Notification Switch
Would you like to follow the 'Statistics i - math1020 - red river college - version 2015 revision a - draft 2015-10-24' conversation and receive update notifications?

|
|

|
|

|
|

|
|

|
|

|
|

|
|

|
|

|
|

|