

| << Chapter < Page | Chapter >> Page > |
A college football coach thought that his players could bench press a mean weight of 275 pounds . The standard deviation of all college football players is unknown . Three of his players thought that the mean weight was more than that amount. They asked 30 of their teammates for their estimated maximum lift on the bench press exercise. The data ranged from 205 pounds to 385 pounds. The actualdifferent weights were (frequencies are in parentheses)
Conduct a hypothesis test using a 2.5% level of significance to determine if the bench press mean is more than 275 pounds .
Set up the Hypothesis Test:
Since the problem is about a mean weight, this is a test of a single population mean .
: : This is a right-tailed test.
Calculating the distribution needed:
Random variable: = the mean weight, in pounds, lifted by the football players.
Distribution for the test: It is student t-test because is unknown, so we will need to check normal distribution assumptions by looking at a histogram and box plot of the data as well as the descriptive statistics. The data is slightly skewed to the right with no outliers, so we will proceed with some reservation since the data is varies from a normal distribution. The median is 8 points higher than the mean. The sample standard deviation is 55.9. We will round the standard deviation to 56 for calculating the p-value.
~
pounds (from the data).
pounds We assume pounds unless our data shows us otherwise.
Calculate the p-value using the normal distribution for a mean and using the sample mean as input:
) .
Interpretation of the p-value: If is true, then there is a 0.1414 probability (14.14%) that the football players can lift a mean weight of 286.2pounds or more. Because a 14.14% chance is large enough, a mean weight lift of 286.2 pounds or more is not a rare event.
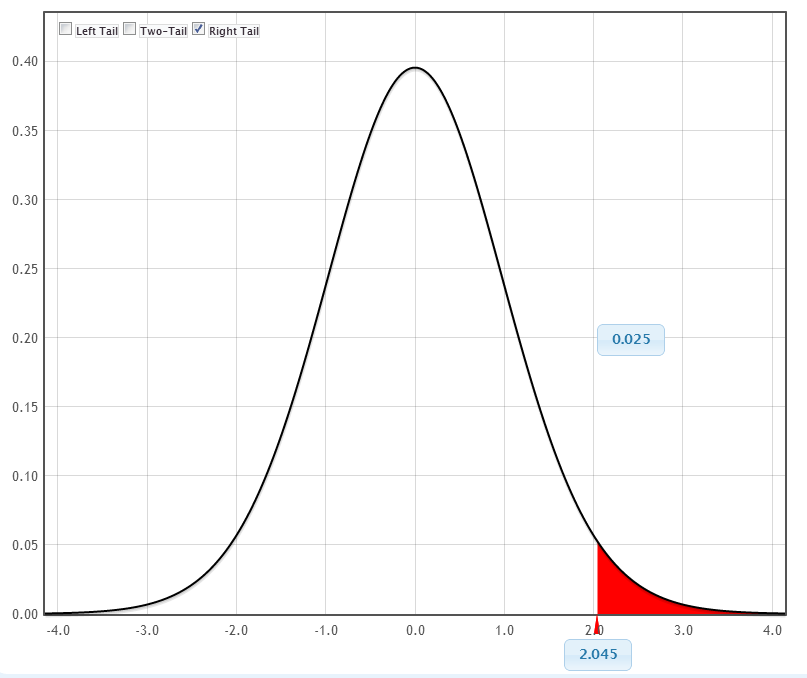
Compare and the p-value:
Make a decision: Since , do not reject .
Conclusion: At the 2.5% level of significance, from the sample data, there is not sufficient evidence to conclude that the true mean weight lifted is more than 275pounds.
Statistics students believe that the mean score on the first statistics test is 65. A statistics instructor thinks the mean score is lower than 65.He samples ten statistics students and obtains the scores
Set up the Hypothesis Test:
A 5% level of significance means that . This is a test of a single population mean .
: :
Since the instructor thinks the average score is lower, use a " ". The " " means the test is left-tailed.
Determine the distribution needed:
Random variable: = average score on the first statistics test.
Distribution for the test: If you read the problem carefully, you will notice that there is no population standard deviation given . You are only given sample data values. Notice also that the data come from a normal distribution. This means that thedistribution for the test is a student's-t.
Use . Therefore, the distribution for the test is where and .
Calculate the p-value using the Student's-t distribution:
) where the sample mean and sample standard deviation are calculated as 63 and 5.0111 from the data.
Interpretation of the p-value: If the null hypothesis is true, then there is a 0.1193 probability (11.93%) that the sample mean is 67 or less.
.png)
Compare and the p-value:
Since and . Therefore, .
Make a decision: Since , fail to reject .
This means you fail to reject . In other words, you believe that there is insufficient evidence that the mean score is less than 65.
Conclusion: At a 5% level of significance, the sample data show sufficient evidence that the mean (average) test score is more than 65, just as the math instructor thinks.
Notification Switch
Would you like to follow the 'Collaborative statistics using spreadsheets' conversation and receive update notifications?

|
|

|
|

|
|

|
|

|
|

|
|

|
|

|
|

|
|

|