<< Chapter < Page Chapter >> Page >

Student learning outcomes

  • The student will calculate confidence intervals for means when the population standard deviation is known.

Given

The mean age for all Foothill College students for a recent Fall term was 33.2. The population standard deviation has been pretty consistent at 15. Suppose that twenty-five Winter students were randomly selected. The mean age for the sample was 30.4. We are interested in the true mean age for Winter Foothill College students. ( (External Link)

Let X = size 12{X={}} {} the age of a Winter Foothill College student

Calculating the confidence interval

x ¯ = size 12{ {overline {x}} ={}} {}

30.4

Got questions? Get instant answers now!

15=(insert symbol here)

σ

Got questions? Get instant answers now!

Define the Random Variable, X , in words.

X =

the mean age of 25 randomly selected Winter Foothill students

Got questions? Get instant answers now!

What is x ¯ size 12{ {overline {x}} } {} estimating?

μ size 12{μ} {}

Got questions? Get instant answers now!

Is σ x size 12{σ rSub { size 8{x} } } {} known?

yes

Got questions? Get instant answers now!

As a result of your answer to (4), state the exact distribution to use when calculating the Confidence Interval.

Normal

Got questions? Get instant answers now!

Explaining the confidence interval

Construct a 95% Confidence Interval for the true mean age of Winter Foothill College students.

How much area is in both tails (combined)? α = size 12{α={}} {} ________

0.05

Got questions? Get instant answers now!

How much area is in each tail? α 2 = size 12{ { {α} over {2} } ={}} {} ________

0.025

Got questions? Get instant answers now!

Identify the following specifications:

  • lower limit =
  • upper limit =
  • error bound =

  • 24.52
  • 36.28
  • 5.88

Got questions? Get instant answers now!

The 95% Confidence Interval is:__________________

( 24 . 52 , 36 . 28 ) size 12{ \( "24","52","36" "." "28" \) } {}

Got questions? Get instant answers now!

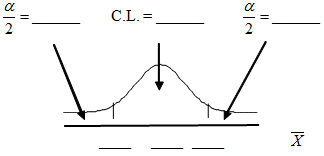
Fill in the blanks on the graph with the areas, upper and lower limits of the confidence interval, and the sample mean.

Normal distribution curve with two vertical upward lines from the x-axis to the curve. The confidence interval is between these two lines. The residual areas are on either side.

Got questions? Get instant answers now!

In one complete sentence, explain what the interval means.

Got questions? Get instant answers now!

Discussion questions

Using the same mean, standard deviation and level of confidence, suppose that n size 12{n} {} were 69 instead of 25. Would the error bound become larger or smaller? How do you know?

Got questions? Get instant answers now!

Using the same mean, standard deviation and sample size, how would the error bound change if the confidence level were reduced to 90%? Why?

Got questions? Get instant answers now!

Get Jobilize Job Search Mobile App in your pocket Now!

Get it on Google Play Download on the App Store Now


Source:  OpenStax, Collaborative statistics. OpenStax CNX. Jul 03, 2012 Download for free at http://cnx.org/content/col10522/1.40
Google Play and the Google Play logo are trademarks of Google Inc.

Notification Switch

Would you like to follow the 'Collaborative statistics' conversation and receive update notifications?

Ask