

| << Chapter < Page | Chapter >> Page > |
Visit this website to view a list of Ford car prices between 1909 and 1927. Consider how these prices compare to today’s models. Is the product today of a different quality?
A new product can be thought of as an extreme improvement in quality—from something that did not exist to something that does. However, the basket of goods that was fixed in the past obviously does not include new goods created since then. The basket of goods and services used in the Consumer Price Index (CPI) is revised and updated over time, and so new products are gradually included. But the process takes some time. For example, room air conditioners were widely sold in the early 1950s, but were not introduced into the basket of goods behind the Consumer Price Index until 1964. The VCR and personal computer were available in the late 1970s and widely sold by the early 1980s, but did not enter the CPI basket of goods until 1987. By 1996, there were more than 40 million cellular phone subscribers in the United States—but cell phones were not yet part of the CPI basket of goods. The parade of inventions has continued, with the CPI inevitably lagging a few years behind.
The arrival of new goods creates problems with respect to the accuracy of measuring inflation. The reason people buy new goods, presumably, is that the new goods offer better value for money than existing goods. Thus, if the price index leaves out new goods, it overlooks one of the ways in which the cost of living is improving. In addition, the price of a new good is often higher when it is first introduced and then declines over time. If the new good is not included in the CPI for some years, until its price is already lower, the CPI may miss counting this price decline altogether. Taking these arguments together, the quality/new goods bias means that the rise in the price of a fixed basket of goods over time tends to overstate the rise in a consumer’s true cost of living, because it does not take into account how improvements in the quality of existing goods or the invention of new goods improves the standard of living. The following Clear It Up feature is a must-read on how the CPI is comprised and calculated.
When the U.S. Bureau of Labor Statistics (BLS) calculates the Consumer Price Index, the first task is to decide on a basket of goods that is representative of the purchases of the average household. This is done by using the Consumer Expenditure Survey, a national survey of about 7,000 households, which provides detailed information on spending habits. Consumer expenditures are broken up into eight major groups, shown below, which in turn are broken up into more than 200 individual item categories. The BLS currently uses 1982–1984 as the base period.
For each of the 200 individual expenditure items, the BLS chooses several hundred very specific examples of that item and looks at the prices of those examples. So, in figuring out the “breakfast cereal” item under the overall category of “foods and beverages,” the BLS picks several hundred examples of breakfast cereal. One example might be the price of a 24-oz. box of a particular brand of cereal sold at a particular store. The specific products and sizes and stores chosen are statistically selected to reflect what people buy and where they shop. The basket of goods in the Consumer Price Index thus consists of about 80,000 products; that is, several hundred specific products in over 200 broad-item categories. About one-quarter of these 80,000 specific products are rotated out of the sample each year, and replaced with a different set of products.
The next step is to collect data on prices. Data collectors visit or call about 23,000 stores in 87 urban areas all over the United States every month to collect prices on these 80,000 specific products. A survey of 50,000 landlords or tenants is also carried out to collect information about rents.
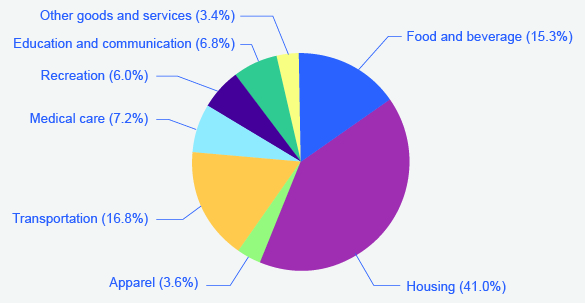
The Consumer Price Index is then calculated by taking the 80,000 prices of individual products and combining them, using weights (as shown in [link] ) determined by the quantities of these products that people buy and allowing for factors like substitution between goods and quality improvements, into price indices for the 200 or so overall items. Then, the price indices for the 200 items are combined into an overall Consumer Price Index. According the Consumer Price Index website, there are eight categories used by data collectors:
The Eight Major Categories in the Consumer Price Index
Notification Switch
Would you like to follow the 'University of houston downtown: macroeconomics' conversation and receive update notifications?

|
|

|
|

|
|

|
|

|
|

|
|

|
|

|
|
|
|
|

|