It is important that the "standard deviation" used must be appropriate for the parameter we are estimating. So in this section, we need to use the standard deviation that applies to sample means, which is
.
is commonly called the "standard error of the mean" in order to clearly distinguish the standard deviation for a mean from the population standard deviation
.
In summary, as a result of the central limit theorem:
-
is normally distributed, that is,
~
-
When the population standard deviation
is known, we use a Normal distribution to calculate the error bound.
Calculating the confidence interval:
To construct a confidence interval estimate for an unknown population mean, we need data from a random sample. The steps to construct and interpret the confidence interval are:
- Calculate the sample mean
from the sample data. Remember, in this section, we already know the population standard deviation
.
- Find the Z-score that corresponds to the confidence level.
- Calculate the error bound EBM
- Construct the confidence interval
- Write a sentence that interprets the estimate in the context of the situation in the problem. (Explain what the confidence interval means, in the words of the problem.)
We will first examine each step in more detail, and then illustrate the process with some examples.
Finding z for the stated confidence level
When we know the population standard deviation σ, we use a standard normal distribution to calculate the error bound EBM and construct the confidence interval. We need to find the value of Z that puts an area equal to the confidence level (in decimal form) in the middle of the standard normal distribution Z~N(0,1).
The confidence level,
, is
he area in the middle of the standard normal distribution.
.
So
is the area that is split equally between the two tails. Each of the tails contains an area
equal to
.
The z-score that has an area to the right of
is denoted by
For example, when
then
and
;
we write
The area to the right of
is 0.025 and the area to the left of
is 1-0.025 = 0.975
, using a calculator, computer or a Standard Normal probability table.
Using the TI83, TI83+ or TI84+ calculator:
invNorm
CALCULATOR NOTE: Remember to use area to the LEFT of
; in this chapter the last two inputs in the invnorm command are 0,1 because you are using a Standard Normal Distribution Z~N(0,1)
Ebm: error bound
The error bound formula for an unknown population mean
when the population standard deviation
is known is
Constructing the confidence interval
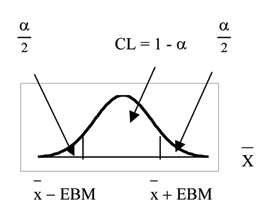
- The confidence interval estimate has the format
.
The graph gives a picture of the entire situation.
.

Writing the interpretation
The interpretation should clearly state the confidence level (CL), explain what population parameter is being estimated (here, a
population mean or average ), and should state the confidence interval (both endpoints).
"We estimate with ___% confidence that the true population average (include context of the problem) is between ___ and ___ (include appopriate units)."

