

| << Chapter < Page | Chapter >> Page > |
Suppose average pizza delivery times with an unknown population mean has a population standard deviation of six minutes. A random sample of 28 pizza delivery restaurants is taken and has a sample mean delivery time of 36 minutes.
Find a 90% confidence interval estimate for the population mean delivery time.
(34.1347, 37.8653)
The Specific Absorption Rate (SAR) for a cell phone measures the amount of radio frequency (RF) energy absorbed by the user’s body when using the handset. Every cell phone emits RF energy. Different phone models have different SAR measures. To receive certification from the Federal Communications Commission (FCC) for sale in the United States, the SAR level for a cell phone must be no more than 1.6 watts per kilogram. [link] shows the highest SAR level for a random selection of cell phone models as measured by the FCC.
| Phone Model | SAR | Phone Model | SAR | Phone Model | SAR |
|---|---|---|---|---|---|
| Apple iPhone 4S | 1.11 | LG Ally | 1.36 | Pantech Laser | 0.74 |
| BlackBerry Pearl 8120 | 1.48 | LG AX275 | 1.34 | Samsung Character | 0.5 |
| BlackBerry Tour 9630 | 1.43 | LG Cosmos | 1.18 | Samsung Epic 4G Touch | 0.4 |
| Cricket TXTM8 | 1.3 | LG CU515 | 1.3 | Samsung M240 | 0.867 |
| HP/Palm Centro | 1.09 | LG Trax CU575 | 1.26 | Samsung Messager III SCH-R750 | 0.68 |
| HTC One V | 0.455 | Motorola Q9h | 1.29 | Samsung Nexus S | 0.51 |
| HTC Touch Pro 2 | 1.41 | Motorola Razr2 V8 | 0.36 | Samsung SGH-A227 | 1.13 |
| Huawei M835 Ideos | 0.82 | Motorola Razr2 V9 | 0.52 | SGH-a107 GoPhone | 0.3 |
| Kyocera DuraPlus | 0.78 | Motorola V195s | 1.6 | Sony W350a | 1.48 |
| Kyocera K127 Marbl | 1.25 | Nokia 1680 | 1.39 | T-Mobile Concord | 1.38 |
Find a 98% confidence interval for the true (population) mean of the Specific Absorption Rates (SARs) for cell phones. Assume that the population standard deviation is
σ = 0.337.
Next, find the EBM . Because you are creating a 98% confidence interval, CL = 0.98.
You need to find Z 0.01 having the property that the area under the normal density curve to the right of Z 0.01 is 0.01 and the area to the left is 0.99. Use your probability table for the standard normal distribution to find Z 0.01 = 2.326. HINT: Look up 0.49 in the body of the Standard Normal table and then find the number of standard deviations from the top and left margins of the table.
To find the 98% confidence interval, find .
– EBM = 1.024 – 0.1431 = 0.8809
– EBM = 1.024 – 0.1431 = 1.1671
We estimate with 98% confidence that the true SAR mean for the population of cell phones in the United States is between 0.8809 and 1.1671 watts per kilogram.
Suppose we change the original problem in [link] by using a 95% confidence level. Find a 95% confidence interval for the true (population) mean statistics exam score.
To find the confidence interval, you need the sample mean, , and the EBM .
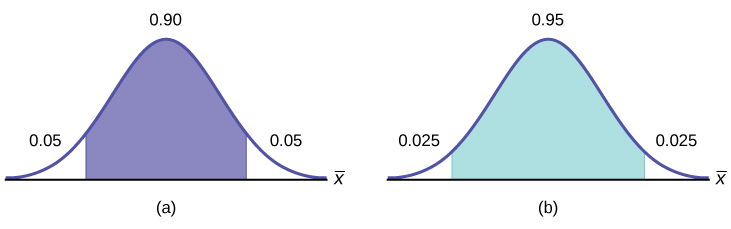
CL = 0.95 so α = 1 – CL = 1 – 0.95 = 0.05
The area to the right of Z 0.025 is 0.025 and the area to the left of Z 0.025 is 1 – 0.025 = 0.975.
EBM = (1.96) = 0.98
– EBM = 68 – 0.98 = 67.02
+ EBM = 68 + 0.98 = 68.98
Notice that the EBM is larger for a 95% confidence level in the original problem.
Notification Switch
Would you like to follow the 'Introductory statistics' conversation and receive update notifications?

|
|

|
|

|
|

|
|

|
|

|
|

|
|

|
|

|
|

|