<< Chapter < Page Chapter >> Page >
  • Locate points in a plane by using polar coordinates.
  • Convert points between rectangular and polar coordinates.
  • Sketch polar curves from given equations.
  • Convert equations between rectangular and polar coordinates.
  • Identify symmetry in polar curves and equations.

The rectangular coordinate system (or Cartesian plane) provides a means of mapping points to ordered pairs and ordered pairs to points. This is called a one-to-one mapping from points in the plane to ordered pairs. The polar coordinate system provides an alternative method of mapping points to ordered pairs. In this section we see that in some circumstances, polar coordinates can be more useful than rectangular coordinates.

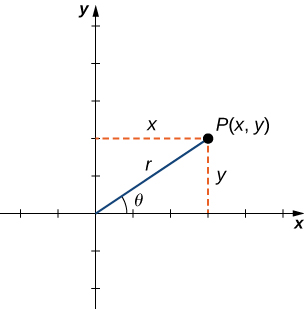
Defining polar coordinates

To find the coordinates of a point in the polar coordinate system, consider [link] . The point P has Cartesian coordinates ( x , y ) . The line segment connecting the origin to the point P measures the distance from the origin to P and has length r . The angle between the positive x -axis and the line segment has measure θ . This observation suggests a natural correspondence between the coordinate pair ( x , y ) and the values r and θ . This correspondence is the basis of the polar coordinate system    . Note that every point in the Cartesian plane has two values (hence the term ordered pair ) associated with it. In the polar coordinate system, each point also two values associated with it: r and θ .

A point P(x, y) is given in the first quadrant with lines drawn to indicate its x and y values. There is a line from the origin to P(x, y) marked r and this line make an angle θ with the x axis.
An arbitrary point in the Cartesian plane.

Using right-triangle trigonometry, the following equations are true for the point P :

cos θ = x r so x = r cos θ
sin θ = y r so y = r sin θ .

Furthermore,

r 2 = x 2 + y 2 and tan θ = y x .

Each point ( x , y ) in the Cartesian coordinate system can therefore be represented as an ordered pair ( r , θ ) in the polar coordinate system. The first coordinate is called the radial coordinate    and the second coordinate is called the angular coordinate    . Every point in the plane can be represented in this form.

Note that the equation tan θ = y / x has an infinite number of solutions for any ordered pair ( x , y ) . However, if we restrict the solutions to values between 0 and 2 π then we can assign a unique solution to the quadrant in which the original point ( x , y ) is located. Then the corresponding value of r is positive, so r 2 = x 2 + y 2 .

Converting points between coordinate systems

Given a point P in the plane with Cartesian coordinates ( x , y ) and polar coordinates ( r , θ ) , the following conversion formulas hold true:

x = r cos θ and y = r sin θ ,
r 2 = x 2 + y 2 and tan θ = y x .

These formulas can be used to convert from rectangular to polar or from polar to rectangular coordinates.

Converting between rectangular and polar coordinates

Convert each of the following points into polar coordinates.

  1. ( 1 , 1 )
  2. ( −3 , 4 )
  3. ( 0 , 3 )
  4. ( 5 3 , −5 )

Convert each of the following points into rectangular coordinates.

  1. ( 3 , π / 3 )
  2. ( 2 , 3 π / 2 )
  3. ( 6 , −5 π / 6 )
  1. Use x = 1 and y = 1 in [link] :
    r 2 = x 2 + y 2 = 1 2 + 1 2 r = 2 and tan θ = y x = 1 1 = 1 θ = π 4 .

    Therefore this point can be represented as ( 2 , π 4 ) in polar coordinates.
  2. Use x = −3 and y = 4 in [link] :
    r 2 = x 2 + y 2 = ( −3 ) 2 + ( 4 ) 2 r = 5 and tan θ = y x = 4 3 θ = arctan ( 4 3 ) 2.21.

    Therefore this point can be represented as ( 5 , 2.21 ) in polar coordinates.
  3. Use x = 0 and y = 3 in [link] :
    r 2 = x 2 + y 2 = ( 3 ) 2 + ( 0 ) 2 = 9 + 0 r = 3 and tan θ = y x = 3 0 .

    Direct application of the second equation leads to division by zero. Graphing the point ( 0 , 3 ) on the rectangular coordinate system reveals that the point is located on the positive y -axis. The angle between the positive x -axis and the positive y -axis is π 2 . Therefore this point can be represented as ( 3 , π 2 ) in polar coordinates.
  4. Use x = 5 3 and y = −5 in [link] :
    r 2 = x 2 + y 2 = ( 5 3 ) 2 + ( −5 ) 2 = 75 + 25 r = 10 and tan θ = y x = −5 5 3 = 3 3 θ = π 6 .

    Therefore this point can be represented as ( 10 , π 6 ) in polar coordinates.
  5. Use r = 3 and θ = π 3 in [link] :
    x = r cos θ = 3 cos ( π 3 ) = 3 ( 1 2 ) = 3 2 and y = r sin θ = 3 sin ( π 3 ) = 3 ( 3 2 ) = 3 3 2 .

    Therefore this point can be represented as ( 3 2 , 3 3 2 ) in rectangular coordinates.
  6. Use r = 2 and θ = 3 π 2 in [link] :
    x = r cos θ = 2 cos ( 3 π 2 ) = 2 ( 0 ) = 0 and y = r sin θ = 2 sin ( 3 π 2 ) = 2 ( −1 ) = −2.

    Therefore this point can be represented as ( 0 , −2 ) in rectangular coordinates.
  7. Use r = 6 and θ = 5 π 6 in [link] :
    x = r cos θ = 6 cos ( 5 π 6 ) = 6 ( 3 2 ) = −3 3 and y = r sin θ = 6 sin ( 5 π 6 ) = 6 ( 1 2 ) = −3.

    Therefore this point can be represented as ( −3 3 , −3 ) in rectangular coordinates.
Got questions? Get instant answers now!

Questions & Answers

Ayele, K., 2003. Introductory Economics, 3rd ed., Addis Ababa.
Widad Reply
can you send the book attached ?
Ariel
?
Ariel
What is economics
Widad Reply
the study of how humans make choices under conditions of scarcity
AI-Robot
U(x,y) = (x×y)1/2 find mu of x for y
Desalegn Reply
U(x,y) = (x×y)1/2 find mu of x for y
Desalegn
what is ecnomics
Jan Reply
this is the study of how the society manages it's scarce resources
Belonwu
what is macroeconomic
John Reply
macroeconomic is the branch of economics which studies actions, scale, activities and behaviour of the aggregate economy as a whole.
husaini
etc
husaini
difference between firm and industry
husaini Reply
what's the difference between a firm and an industry
Abdul
firm is the unit which transform inputs to output where as industry contain combination of firms with similar production 😅😅
Abdulraufu
Suppose the demand function that a firm faces shifted from Qd  120 3P to Qd  90  3P and the supply function has shifted from QS  20  2P to QS 10  2P . a) Find the effect of this change on price and quantity. b) Which of the changes in demand and supply is higher?
Toofiq Reply
explain standard reason why economic is a science
innocent Reply
factors influencing supply
Petrus Reply
what is economic.
Milan Reply
scares means__________________ends resources. unlimited
Jan
economics is a science that studies human behaviour as a relationship b/w ends and scares means which have alternative uses
Jan
calculate the profit maximizing for demand and supply
Zarshad Reply
Why qualify 28 supplies
Milan
what are explicit costs
Nomsa Reply
out-of-pocket costs for a firm, for example, payments for wages and salaries, rent, or materials
AI-Robot
concepts of supply in microeconomics
David Reply
economic overview notes
Amahle Reply
identify a demand and a supply curve
Salome Reply
i don't know
Parul
there's a difference
Aryan
Demand curve shows that how supply and others conditions affect on demand of a particular thing and what percent demand increase whith increase of supply of goods
Israr
Hi Sir please how do u calculate Cross elastic demand and income elastic demand?
Abari
Got questions? Join the online conversation and get instant answers!
Jobilize.com Reply

Get Jobilize Job Search Mobile App in your pocket Now!

Get it on Google Play Download on the App Store Now


Source:  OpenStax, Calculus volume 2. OpenStax CNX. Feb 05, 2016 Download for free at http://cnx.org/content/col11965/1.2
Google Play and the Google Play logo are trademarks of Google Inc.

Notification Switch

Would you like to follow the 'Calculus volume 2' conversation and receive update notifications?

Ask