

| << Chapter < Page | Chapter >> Page > |
List two difficulties the company might have in obtaining random results, if this survey were done by email.
Use the following information to answer the next five exercises: Of 1,050 randomly selected adults, 360 identified themselves as manual laborers, 280 identified themselves as non-manual wage earners, 250 identified themselves as mid-level managers, and 160 identified themselves as executives. In the survey, 82% of manual laborers preferred trucks, 62% of non-manual wage earners preferred trucks, 54% of mid-level managers preferred trucks, and 26% of executives preferred trucks.
We are interested in finding the 95% confidence interval for the percent of executives who prefer trucks. Define random variables X and P ′ in words.
X is the number of “successes” where an executive prefers a truck. P ′ is the percentage of executives sampled who prefer a truck.
Which distribution should you use for this problem?
Construct a 95% confidence interval. State the confidence interval, sketch the graph, and calculate the error bound.
CI: (0.19432, 0.33068)
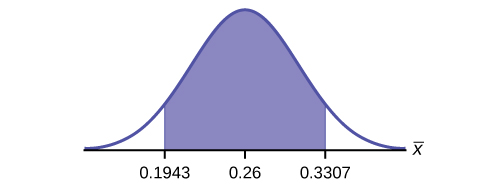
EBM : 0.0707
Suppose we want to lower the sampling error. What is one way to accomplish that?
The sampling error given in the survey is ±2%. Explain what the ±2% means.
The sampling error means that the true mean can be 2% above or below the sample mean.
Use the following information to answer the next five exercises: A poll of 1,200 voters asked what the most significant issue was in the upcoming election. Sixty-five percent answered the economy. We are interested in the population proportion of voters who feel the economy is the most important.
Define the random variable X in words.
Define the random variable P ′ in words.
P ′ is the proportion of voters sampled who said the economy is the most important issue in the upcoming election.
Which distribution should you use for this problem?
Construct a 90% confidence interval, and state the confidence interval and the error bound.
CI: (0.62735, 0.67265)
EBM : 0.02265
What would happen to the confidence interval if the level of confidence were 95%?
Use the following information to answer the next 16 exercises: The Ice Chalet offers dozens of different beginning ice-skating classes. All of the class names are put into a bucket. The 5 P.M., Monday night, ages 8 to 12, beginning ice-skating class was picked. In that class were 64 girls and 16 boys. Suppose that we are interested in the true proportion of girls, ages 8 to 12, in all beginning ice-skating classes at the Ice Chalet. Assume that the children in the selected class are a random sample of the population.
What is being counted?
The number of girls, ages 8 to 12, in the 5 P.M. Monday night beginning ice-skating class.
In words, define the random variable X .
Calculate the following:
State the estimated distribution of X . X ~________
Define a new random variable P ′. What is p ′ estimating?
p
In words, define the random variable P ′.
State the estimated distribution of P ′. Construct a 92% Confidence Interval for the true proportion of girls in the ages 8 to 12 beginning ice-skating classes at the Ice Chalet.
. (0.72171, 0.87829).
How much area is in both tails (combined)?
How much area is in each tail?
0.04
Calculate the following:
The 92% confidence interval is _______.
(0.72; 0.88)
Fill in the blanks on the graph with the areas, upper and lower limits of the confidence interval, and the sample proportion.

In one complete sentence, explain what the interval means.
With 92% confidence, we estimate the proportion of girls, ages 8 to 12, in a beginning ice-skating class at the Ice Chalet to be between 72% and 88%.
Using the same p ′ and level of confidence, suppose that n were increased to 100. Would the error bound become larger or smaller? How do you know?
Using the same p ′ and n = 80, how would the error bound change if the confidence level were increased to 98%? Why?
The error bound would increase. Assuming all other variables are kept constant, as the confidence level increases, the area under the curve corresponding to the confidence level becomes larger, which creates a wider interval and thus a larger error.
If you decreased the allowable error bound, why would the minimum sample size increase (keeping the same level of confidence)?
Notification Switch
Would you like to follow the 'Statistics i - math1020 - red river college - version 2015 revision a - draft 2015-10-24' conversation and receive update notifications?

|
|

|
|

|
|

|
|

|
|

|
|

|
|

|
|

|
|

|