

| << Chapter < Page | Chapter >> Page > |
The “plus four” method for calculating confidence intervals is an attempt to balance the error introduced by using estimates of the population proportion when calculating the standard deviation of the sampling distribution. Simply imagine four additional trials in the study; two are successes and two are failures. Calculate , and proceed to find the confidence interval. When sample sizes are small, this method has been demonstrated to provide more accurate confidence intervals than the standard formula used for larger samples.
p′ = x / n where x represents the number of successes and n represents the sample size. The variable p ′ is the sample proportion and serves as the point estimate for the true population proportion.
q ′ = 1 – p ′
The variable p′ has a binomial distribution that can be approximated with the normal distribution shown here.
EBP = the error bound for a proportion =
Confidence interval for a proportion:
provides the number of participants needed to estimate the population proportion with confidence 1 - α and margin of error EBP .
Use the normal distribution for a single population proportion
The confidence interval has the format ( p′ – EBP , p′ + EBP ).
is a point estimate for μ
p′ is a point estimate for ρ
s is a point estimate for σ
Use the following information to answer the next two exercises: Marketing companies are interested in knowing the population percent of women who make the majority of household purchasing decisions.
When designing a study to determine this population proportion, what is the minimum number you would need to survey to be 90% confident that the population proportion is estimated to within 0.05?
If it were later determined that it was important to be more than 90% confident and a new survey were commissioned, how would it affect the minimum number you need to survey? Why?
It would decrease, because the z-score would decrease, which reducing the numerator and lowering the number.
Use the following information to answer the next five exercises: Suppose the marketing company did do a survey. They randomly surveyed 200 households and found that in 120 of them, the woman made the majority of the purchasing decisions. We are interested in the population proportion of households where women make the majority of the purchasing decisions.
Identify the following:
Define the random variables X and P′ in words.
X is the number of “successes” where the woman makes the majority of the purchasing decisions for the household. P ′ is the percentage of households sampled where the woman makes the majority of the purchasing decisions for the household.
Which distribution should you use for this problem?
Construct a 95% confidence interval for the population proportion of households where the women make the majority of the purchasing decisions. State the confidence interval, sketch the graph, and calculate the error bound.
CI: (0.5321, 0.6679)
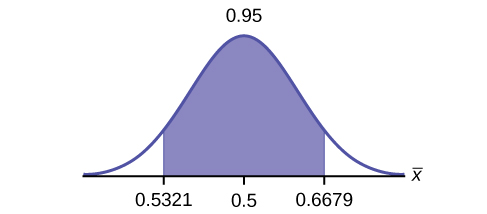
EBM : 0.0679
Notification Switch
Would you like to follow the 'Statistics i - math1020 - red river college - version 2015 revision a - draft 2015-10-24' conversation and receive update notifications?

|
|

|
|

|
|

|
|

|
|

|
|
|
|
|

|
|

|
|

|