An explanation and picture of the frequency allocation chart.
To prevent radio stations from transmitting signals “on top of
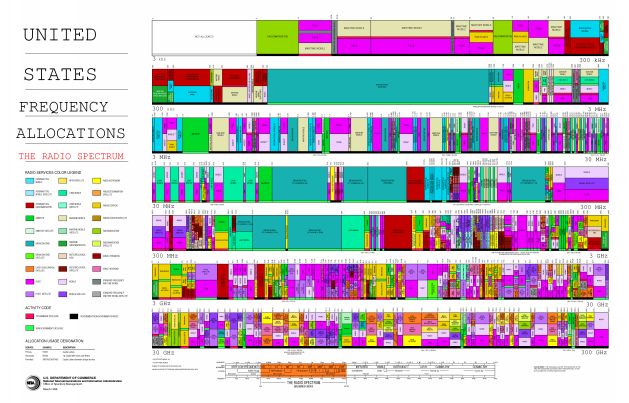
each other,” the United States and other national governmentsin the 1930s began regulating the carrier frequencies and power
outputs stations could use. With increased use of the radiospectrum for both public and private use, this regulation has
become increasingly important. This is the so-called
Frequency Allocation Chart , which shows what kinds
of broadcasting can occur in which frequency bands. Detailedradio carrier frequency assignments are much too detailed to
present here.
Frequency allocation chart
Questions & Answers
if three forces F1.f2 .f3 act at a point on a Cartesian plane in the daigram .....so if the question says write down the x and y components ..... I really don't understand
a fixed gas of a mass is held at standard pressure temperature of 15 degrees Celsius .Calculate the temperature of the gas in Celsius if the pressure is changed to 2×10 to the power 4