<< Chapter < Page Chapter >> Page >
By the end of this section, you will be able to:
  • Discuss the need for a comprehensive classification system
  • List the different levels of the taxonomic classification system
  • Describe how systematics and taxonomy relate to phylogeny
  • Discuss the components and purpose of a phylogenetic tree
  • Compare homologous and analogous traits
  • Discuss the purpose of cladistics
  • Describe maximum parsimony

Introduction

 Photo shows a bee collecting nectar from a flower.
The life of a bee is very different from the life of a flower, but the two organisms are related. Both are members the domain Eukarya and have cells containing many similar organelles, genes, and proteins. (credit: modification of work by John Beetham)

This bee and Echinacea flower ( [link] ) could not look more different, yet they are related, as are all living organisms on Earth. By following pathways of similarities and changes—both visible and genetic—scientists seek to map the evolutionary past of how life developed from single-celled organisms to the tremendous collection of creatures that have germinated, crawled, floated, swam, flown, and walked on this planet.

In scientific terms, the evolutionary history and relationship of an organism or group of organisms is called phylogeny. Phylogeny describes the relationships of an organism, such as from which organisms it is thought to have evolved, to which species it is most closely related, and so forth. Phylogenetic relationships provide information on shared ancestry but not necessarily on how organisms are similar or different.

Phylogenetic trees

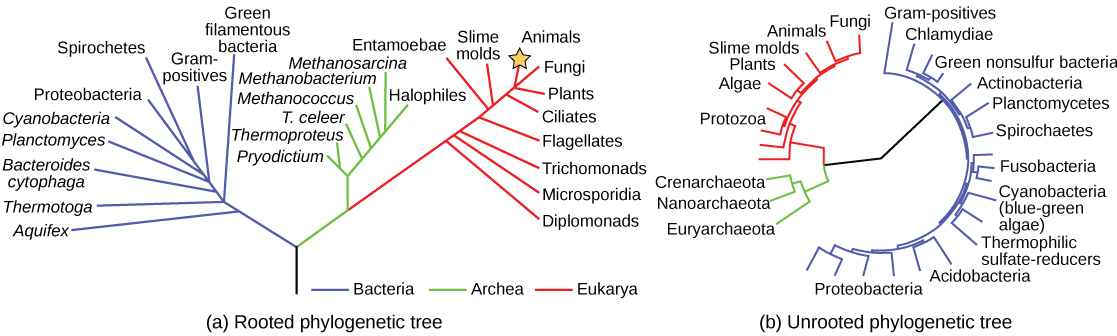
Scientists use a tool called a phylogenetic tree to show the evolutionary pathways and connections among organisms. A phylogenetic tree    is a diagram used to reflect evolutionary relationships among organisms or groups of organisms. Scientists consider phylogenetic trees to be a hypothesis of the evolutionary past since one cannot go back to confirm the proposed relationships. In other words, a “tree of life” can be constructed to illustrate when different organisms evolved and to show the relationships among different organisms ( [link] ).

Unlike a taxonomic classification diagram, a phylogenetic tree can be read like a map of evolutionary history. Many phylogenetic trees have a single lineage at the base representing a common ancestor. Scientists call such trees rooted    , which means there is a single ancestral lineage (typically drawn from the bottom or left) to which all organisms represented in the diagram relate. Notice in the rooted phylogenetic tree that the three domains— Bacteria, Archaea, and Eukarya—diverge from a single point and branch off. The small branch that plants and animals (including humans) occupy in this diagram shows how recent and miniscule these groups are compared with other organisms. Unrooted trees don’t show a common ancestor but do show relationships among species.

The phylogenetic tree in part a is rooted and resembles a living tree, with a common ancestor indicated as the base of the trunk. Two branches form from the trunk. The left branch leads to the domain Bacteria. The right branch branches again, giving rise to Archaea and Eukarya. Smaller branches within each domain indicate the groups present in that domain. The phylogenetic tree in part B is unrooted. It does not resemble a living tree; rather, groups of organisms within the Archaea, Eukarya, and Bacteria domains are arranged in a circle. Lines connect the groups within each domain. The groups within Archaea and Eukarya are then connected together. A line from the Archaea/ Eukarya domains, and another from the Bacteria meet in the center of the circle. There is no root, and therefore no indication of which domain arose first.
Both of these phylogenetic trees shows the relationship of the three domains of life—Bacteria, Archaea, and Eukarya—but the (a) rooted tree attempts to identify when various species diverged from a common ancestor while the (b) unrooted tree does not. (credit a: modification of work by Eric Gaba)

Questions & Answers

how do you get the 2/50
Abba Reply
number of sport play by 50 student construct discrete data
Aminu Reply
width of the frangebany leaves on how to write a introduction
Theresa Reply
Solve the mean of variance
Veronica Reply
Step 1: Find the mean. To find the mean, add up all the scores, then divide them by the number of scores. ... Step 2: Find each score's deviation from the mean. ... Step 3: Square each deviation from the mean. ... Step 4: Find the sum of squares. ... Step 5: Divide the sum of squares by n – 1 or N.
kenneth
what is error
Yakuba Reply
Is mistake done to something
Vutshila
Hy
anas
hy
What is the life teble
anas
hy
Jibrin
statistics is the analyzing of data
Tajudeen Reply
what is statics?
Zelalem Reply
how do you calculate mean
Gloria Reply
diveving the sum if all values
Shaynaynay
let A1,A2 and A3 events be independent,show that (A1)^c, (A2)^c and (A3)^c are independent?
Fisaye Reply
what is statistics
Akhisani Reply
data collected all over the world
Shaynaynay
construct a less than and more than table
Imad Reply
The sample of 16 students is taken. The average age in the sample was 22 years with astandard deviation of 6 years. Construct a 95% confidence interval for the age of the population.
Aschalew Reply
Bhartdarshan' is an internet-based travel agency wherein customer can see videos of the cities they plant to visit. The number of hits daily is a normally distributed random variable with a mean of 10,000 and a standard deviation of 2,400 a. what is the probability of getting more than 12,000 hits? b. what is the probability of getting fewer than 9,000 hits?
Akshay Reply
Bhartdarshan'is an internet-based travel agency wherein customer can see videos of the cities they plan to visit. The number of hits daily is a normally distributed random variable with a mean of 10,000 and a standard deviation of 2,400. a. What is the probability of getting more than 12,000 hits
Akshay
1
Bright
Sorry i want to learn more about this question
Bright
Someone help
Bright
a= 0.20233 b=0.3384
Sufiyan
a
Shaynaynay
How do I interpret level of significance?
Mohd Reply
It depends on your business problem or in Machine Learning you could use ROC- AUC cruve to decide the threshold value
Shivam
how skewness and kurtosis are used in statistics
Owen Reply
yes what is it
Taneeya
Got questions? Join the online conversation and get instant answers!
Jobilize.com Reply

Get Jobilize Job Search Mobile App in your pocket Now!

Get it on Google Play Download on the App Store Now


Source:  OpenStax, Bi 101 for lbcc ilearn campus. OpenStax CNX. Nov 28, 2013 Download for free at http://legacy.cnx.org/content/col11593/1.1
Google Play and the Google Play logo are trademarks of Google Inc.

Notification Switch

Would you like to follow the 'Bi 101 for lbcc ilearn campus' conversation and receive update notifications?

Ask