<< Chapter < Page Chapter >> Page >

Notice the difference in the confidence intervals calculated in [link] and the following Try It exercise. These intervals are different for several reasons: they were calculated from different samples, the samples were different sizes, and the intervals were calculated for different levels of confidence. Even though the intervals are different, they do not yield conflicting information. The effects of these kinds of changes are the subject of the next section in this chapter.

Changing the confidence level or sample size

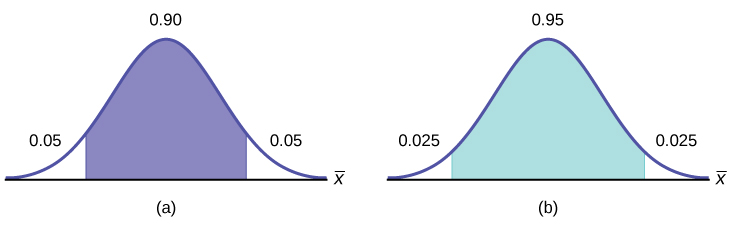
Suppose we change the original problem in [link] by using a 95% confidence level. Find a 95% confidence interval for the true (population) mean statistics exam score.

To find the confidence interval, you need the sample mean, x ¯ , and the EBM .

  • x ¯ = 68
  • EBM = ( z α 2 ) ( σ n )
  • σ = 3; n = 36; The confidence level is 95% ( CL = 0.95).

CL = 0.95 so α = 1 – CL = 1 – 0.95 = 0.05

α 2 = 0.025 z α 2 = z 0.025

The area to the right of z 0.025 is 0.025 and the area to the left of z 0.025 is 1 – 0.025 = 0.975.

z α 2 = z 0.025 = 1.96

This can be found using appropriate commands on calculators, using a computer, or using a probability table for the standard normal distribution.

EBM = (1.96) ( 3 36 ) = 0.98

x ¯ EBM = 68 – 0.98 = 67.02

x ¯ + EBM = 68 + 0.98 = 68.98

Notice that the EBM is larger for a 95% confidence level in the original problem.

Interpretation

We estimate with 95% confidence that the true population mean for all statistics exam scores is between 67.02 and 68.98.

Explanation of 95% confidence level

Ninety-five percent of all confidence intervals constructed in this way contain the true value of the population mean statistics exam score.

Comparing the results

The 90% confidence interval is (67.18, 68.82). The 95% confidence interval is (67.02, 68.98). The 95% confidence interval is wider. If you look at the graphs, because the area 0.95 is larger than the area 0.90, it makes sense that the 95% confidence interval is wider. To be more confident that the confidence interval actually does contain the true value of the population mean for all statistics exam scores, the confidence interval necessarily needs to be wider.

Part (a) shows a normal distribution curve. A central region with area equal to 0.90 is shaded. Each unshaded tail of the curve has area equal to 0.05. Part (b) shows a normal distribution curve. A central region with area equal to 0.95 is shaded. Each unshaded tail of the curve has area equal to 0.025.

    Summary: Effect of Changing the Confidence Level

  • Increasing the confidence level increases the error bound, making the confidence interval wider.
  • Decreasing the confidence level decreases the error bound, making the confidence interval narrower.

Try it

Refer back to the pizza-delivery Try It exercise. The population standard deviation is six minutes and the sample mean deliver time is 36 minutes. Use a sample size of 20. Find a 95% confidence interval estimate for the true mean pizza delivery time.

(33.37, 38.63)

Suppose we change the original problem in [link] to see what happens to the error bound if the sample size is changed.

Leave everything the same except the sample size. Use the original 90% confidence level. What happens to the error bound and the confidence interval if we increase the sample size and use n = 100 instead of n = 36? What happens if we decrease the sample size to n = 25 instead of n = 36?

  • x ¯ = 68
  • EBM = ( z α 2 ) ( σ n )
  • σ = 3; The confidence level is 90% ( CL =0.90); z α 2 = z 0.05 = 1.645.

Solution b

If we decrease the sample size n to 25, we increase the error bound.

When n = 25: EBM = ( z α 2 ) ( σ n ) = (1.645) ( 3 25 ) = 0.987.

    Summary: effect of changing the sample size

  • Increasing the sample size causes the error bound to decrease, making the confidence interval narrower.
  • Decreasing the sample size causes the error bound to increase, making the confidence interval wider.

Get Jobilize Job Search Mobile App in your pocket Now!

Get it on Google Play Download on the App Store Now


Source:  OpenStax, Statistics i - math1020 - red river college - version 2015 revision a - draft 2015-10-24. OpenStax CNX. Oct 24, 2015 Download for free at http://legacy.cnx.org/content/col11891/1.8
Google Play and the Google Play logo are trademarks of Google Inc.

Notification Switch

Would you like to follow the 'Statistics i - math1020 - red river college - version 2015 revision a - draft 2015-10-24' conversation and receive update notifications?

Ask