<< Chapter < Page Chapter >> Page >

Probabilities are calculated by using technology. There are instructions in the chapter for the TI-83+ and TI-84 calculators.

In the Table of Contents for Collaborative Statistics , entry 15. Tables has a link to a table of normal probabilities. Use the probability tables if so desired, instead of a calculator. The tables include instructions for how to use then.

If the area to the left is 0.0228, then the area to the right is 1 - 0.0228 = 0.9772 .

Got questions? Get instant answers now!

The final exam scores in a statistics class were normally distributed with a mean of 63 and a standard deviation of 5.

Find the probability that a randomly selected student scored more than 65 on the exam.

Let X = a score on the final exam. X ~ N ( 63 , 5 ) , where μ = 63 and σ = 5

Draw a graph.

Then, find P ( x 65 ) .

P ( x 65 ) = 0.3446 (calculator or computer)

Normal distribution curve with values of 63 and 65. A vertical upward line extends from point 65 to the curve. The probability area from point 65 to the end of the curve is equal to 0.3446.

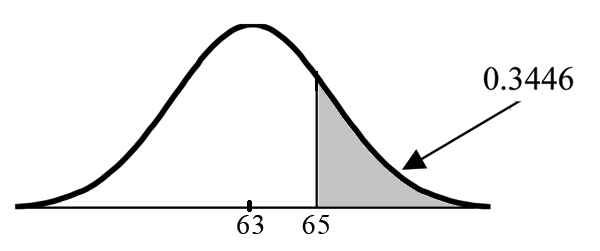
The probability that one student scores more than 65 is 0.3446.

Using the TI-83+ or the TI-84 calculators, the calculation is as follows. Go into 2nd DISTR .

After pressing 2nd DISTR , press 2:normalcdf .

The syntax for the instructions are shown below.

normalcdf(lower value, upper value, mean, standard deviation) For this problem:normalcdf(65,1E99,63,5) = 0.3446. You get 1E99 ( = 10 99 ) by pressing 1 , the EE key (a 2nd key) and then 99 . Or, you can enter 10^99 instead. The number 10 99 is way out in the right tail of the normal curve. We are calculating the areabetween 65 and 10 99 . In some instances, the lower number of the area might be -1E99 ( = -10 99 ). The number -10 99 is way out in the left tail of the normal curve.

The TI probability program calculates a z-score and then the probability from the z-score. Before technology, the z-score was looked up in a standard normal probability table(because the math involved is too cumbersome) to find the probability. In this example, a standard normal table with area to the left of the z-score was used. You calculate the z-score and look up the area to the left.The probability is the area to the right.

z = 65 - 63 5 = 0.4 . Area to the left is 0.6554. P ( x 65 ) = P ( z 0.4 ) = 1 - 0.6554 = 0.3446

Got questions? Get instant answers now!

Find the probability that a randomly selected student scored less than 85.

Draw a graph.

Then find P ( x 85 ) . Shade the graph. P ( x 85 ) = 1 (calculator or computer)

The probability that one student scores less than 85 is approximately 1 (or 100%).

The TI-instructions and answer are as follows:

normalcdf(0,85,63,5) = 1 (rounds to 1)

Got questions? Get instant answers now!

Find the 90th percentile (that is, find the score k that has 90 % of the scores below k and 10% of the scores above k).

Find the 90th percentile. For each problem or part of a problem, draw a new graph. Draw the x-axis. Shade the area that corresponds to the 90th percentile.

Let k = the 90th percentile. k is located on the x-axis. P ( x k ) is the area to the left of k . The 90th percentile k separates the exam scores into those that are the same or lower than k and those that are the same or higher. Ninety percent of the test scores are the same or lower than k and 10% are the same or higher. k is often called a critical value .

k = 69.4 (calculator or computer)

Normal distribution curve with values of 63 and x on the x-axis. The x-axis is equal to X. A vertical upward line extends from point x to the curve. The probability area, occurring from the beginning of the curve to point x, is equal to 0.90.

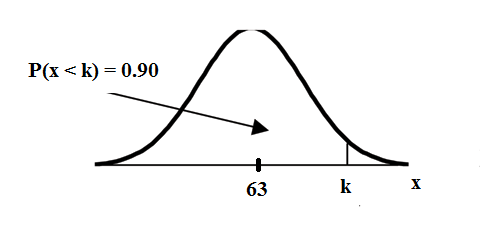
The 90th percentile is 69.4. This means that 90% of the test scores fall at or below 69.4 and 10% fall at or above.For the TI-83+ or TI-84 calculators, use invNorm in 2nd DISTR . invNorm(area to the left, mean, standard deviation)For this problem, invNorm(0.90,63,5) = 69.4

Got questions? Get instant answers now!

Find the 70th percentile (that is, find the score k such that 70% of scores are below k and 30% of the scores are above k).

Find the 70th percentile.

Draw a new graph and label it appropriately. k = 65.6

The 70th percentile is 65.6. This means that 70% of the test scores fall at or below 65.5 and 30% fall at or above.

invNorm(0.70,63,5) = 65.6

Got questions? Get instant answers now!

A computer is used for office work at home, research, communication, personal finances, education, entertainment, social networking and a myriad of other things. Suppose that the average number of hours a householdpersonal computer is used for entertainment is 2 hours per day. Assume the times for entertainment are normally distributed and the standard deviation for the times is half an hour.

Find the probability that a household personal computer is used between 1.8 and 2.75 hours per day.

Let X = the amount of time (in hours) a household personal computer is used for entertainment. x ~ N ( 2 , 0.5 ) where μ = 2 and σ = 0.5 .

Find P ( 1.8 < x < 2.75 ) .

The probability for which you are looking is the area between x = 1.8 and x = 2.75 . P ( 1.8 x 2.75 ) = 0.5886

Normal distribution curve with values 1.8, 2, and 2.75 on the x-axis. The x-axis is equal to X. Vertical upward lines extend upward from 1.8 and 2.75 to the curve.

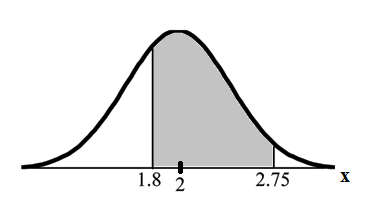
normalcdf(1.8,2.75,2,0.5) = 0.5886

The probability that a household personal computer is used between 1.8 and 2.75 hours per day for entertainment is 0.5886.

Got questions? Get instant answers now!

Find the maximum number of hours per day that the bottom quartile of households use a personal computer for entertainment.

To find the maximum number of hours per day that the bottom quartile of households uses a personal computer for entertainment, find the 25th percentile, k , where P ( x k ) = 0.25 .

Normal distribution curve with value k on the x-axis. The probability area from k to the end of the curve is equal to 0.75 and the rest of the area is equal to 0.25.

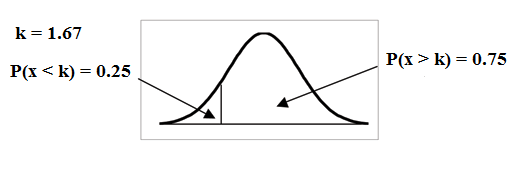
invNorm(0.25,2,.5) = 1.66

The maximum number of hours per day that the bottom quartile of households uses a personal computer for entertainment is 1.66 hours.

Got questions? Get instant answers now!

Questions & Answers

differentiate between demand and supply giving examples
Lambiv Reply
differentiated between demand and supply using examples
Lambiv
what is labour ?
Lambiv
how will I do?
Venny Reply
how is the graph works?I don't fully understand
Rezat Reply
information
Eliyee
devaluation
Eliyee
t
WARKISA
hi guys good evening to all
Lambiv
multiple choice question
Aster Reply
appreciation
Eliyee
explain perfect market
Lindiwe Reply
In economics, a perfect market refers to a theoretical construct where all participants have perfect information, goods are homogenous, there are no barriers to entry or exit, and prices are determined solely by supply and demand. It's an idealized model used for analysis,
Ezea
What is ceteris paribus?
Shukri Reply
other things being equal
AI-Robot
When MP₁ becomes negative, TP start to decline. Extuples Suppose that the short-run production function of certain cut-flower firm is given by: Q=4KL-0.6K2 - 0.112 • Where is quantity of cut flower produced, I is labour input and K is fixed capital input (K-5). Determine the average product of lab
Kelo
Extuples Suppose that the short-run production function of certain cut-flower firm is given by: Q=4KL-0.6K2 - 0.112 • Where is quantity of cut flower produced, I is labour input and K is fixed capital input (K-5). Determine the average product of labour (APL) and marginal product of labour (MPL)
Kelo
yes,thank you
Shukri
Can I ask you other question?
Shukri
what is monopoly mean?
Habtamu Reply
What is different between quantity demand and demand?
Shukri Reply
Quantity demanded refers to the specific amount of a good or service that consumers are willing and able to purchase at a give price and within a specific time period. Demand, on the other hand, is a broader concept that encompasses the entire relationship between price and quantity demanded
Ezea
ok
Shukri
how do you save a country economic situation when it's falling apart
Lilia Reply
what is the difference between economic growth and development
Fiker Reply
Economic growth as an increase in the production and consumption of goods and services within an economy.but Economic development as a broader concept that encompasses not only economic growth but also social & human well being.
Shukri
production function means
Jabir
What do you think is more important to focus on when considering inequality ?
Abdisa Reply
any question about economics?
Awais Reply
sir...I just want to ask one question... Define the term contract curve? if you are free please help me to find this answer 🙏
Asui
it is a curve that we get after connecting the pareto optimal combinations of two consumers after their mutually beneficial trade offs
Awais
thank you so much 👍 sir
Asui
In economics, the contract curve refers to the set of points in an Edgeworth box diagram where both parties involved in a trade cannot be made better off without making one of them worse off. It represents the Pareto efficient allocations of goods between two individuals or entities, where neither p
Cornelius
In economics, the contract curve refers to the set of points in an Edgeworth box diagram where both parties involved in a trade cannot be made better off without making one of them worse off. It represents the Pareto efficient allocations of goods between two individuals or entities,
Cornelius
Suppose a consumer consuming two commodities X and Y has The following utility function u=X0.4 Y0.6. If the price of the X and Y are 2 and 3 respectively and income Constraint is birr 50. A,Calculate quantities of x and y which maximize utility. B,Calculate value of Lagrange multiplier. C,Calculate quantities of X and Y consumed with a given price. D,alculate optimum level of output .
Feyisa Reply
Answer
Feyisa
c
Jabir
the market for lemon has 10 potential consumers, each having an individual demand curve p=101-10Qi, where p is price in dollar's per cup and Qi is the number of cups demanded per week by the i th consumer.Find the market demand curve using algebra. Draw an individual demand curve and the market dema
Gsbwnw Reply
suppose the production function is given by ( L, K)=L¼K¾.assuming capital is fixed find APL and MPL. consider the following short run production function:Q=6L²-0.4L³ a) find the value of L that maximizes output b)find the value of L that maximizes marginal product
Abdureman
types of unemployment
Yomi Reply
What is the difference between perfect competition and monopolistic competition?
Mohammed
Got questions? Join the online conversation and get instant answers!
Jobilize.com Reply

Get Jobilize Job Search Mobile App in your pocket Now!

Get it on Google Play Download on the App Store Now


Source:  OpenStax, Collaborative statistics. OpenStax CNX. Jul 03, 2012 Download for free at http://cnx.org/content/col10522/1.40
Google Play and the Google Play logo are trademarks of Google Inc.

Notification Switch

Would you like to follow the 'Collaborative statistics' conversation and receive update notifications?

Ask