<< Chapter < Page Chapter >> Page >

By the end of this section, you will be able to:

  • Explain how income, prices, and preferences affect consumer choices
  • Contrast the substitution effect and the income effect
  • Utilize concepts of demand to analyze consumer choices
  • Apply utility-maximizing choices to governments and businesses

Just as utility and marginal utility can be used to discuss making consumer choices along a budget constraint, these ideas can also be used to think about how consumer choices change when the budget constraint shifts in response to changes in income or price. Indeed, because the budget constraint framework can be used to analyze how quantities demanded change because of price movements, the budget constraint model can illustrate the underlying logic behind demand curves.

How changes in income affect consumer choices

Let’s begin with a concrete example illustrating how changes in income level affect consumer choices. [link] shows a budget constraint    that represents Kimberly’s choice between concert tickets at $50 each and getting away overnight to a bed-and-breakfast for $200 per night. Kimberly has $1,000 per year to spend between these two choices. After thinking about her total utility and marginal utility and applying the decision rule that the ratio of the marginal utilities to the prices should be equal between the two products, Kimberly chooses point M, with eight concerts and three overnight getaways as her utility-maximizing choice.

How a change in income affects consumption choices

The graph's various points represent which good is viewed as inferior. The first solid downward sloping line represents the original budget constraint. The second budget constraint represents a different set of options based on the consumer having more money to spend on both items.
The utility-maximizing choice on the original budget constraint is M. The dashed horizontal and vertical lines extending through point M allow you to see at a glance whether the quantity consumed of goods on the new budget constraint is higher or lower than on the original budget constraint. On the new budget constraint, a choice like N will be made if both goods are normal goods. If overnight stays is an inferior good, a choice like P will be made. If concert tickets are an inferior good, a choice like Q will be made.

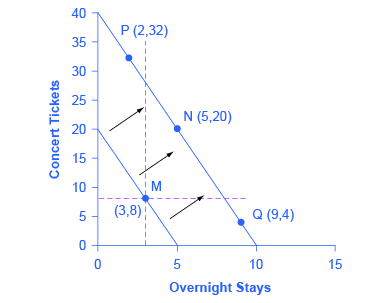
Now, assume that the income Kimberly has to spend on these two items rises to $2,000 per year, causing her budget constraint to shift out to the right. How does this rise in income alter her utility-maximizing choice? Kimberly will again consider the utility and marginal utility that she receives from concert tickets and overnight getaways and seek her utility-maximizing choice on the new budget line. But how will her new choice relate to her original choice?

The possible choices along the new budget constraint can be divided into three groups, which are divided up by the dashed horizontal and vertical lines that pass through the original choice M in the figure. All choices on the upper left of the new budget constraint that are to the left of the vertical dashed line, like choice P with two overnight stays and 32 concert tickets, involve less of the good on the horizontal axis but much more of the good on the vertical axis. All choices to the right of the vertical dashed line and above the horizontal dashed line—like choice N with five overnight getaways and 20 concert tickets—have more consumption of both goods. Finally, all choices that are to the right of the vertical dashed line but below the horizontal dashed line, like choice Q with four concerts and nine overnight getaways, involve less of the good on the vertical axis but much more of the good on the horizontal axis.

Questions & Answers

how do you get the 2/50
Abba Reply
number of sport play by 50 student construct discrete data
Aminu Reply
width of the frangebany leaves on how to write a introduction
Theresa Reply
Solve the mean of variance
Veronica Reply
Step 1: Find the mean. To find the mean, add up all the scores, then divide them by the number of scores. ... Step 2: Find each score's deviation from the mean. ... Step 3: Square each deviation from the mean. ... Step 4: Find the sum of squares. ... Step 5: Divide the sum of squares by n – 1 or N.
kenneth
what is error
Yakuba Reply
Is mistake done to something
Vutshila
Hy
anas
hy
What is the life teble
anas
hy
Jibrin
statistics is the analyzing of data
Tajudeen Reply
what is statics?
Zelalem Reply
how do you calculate mean
Gloria Reply
diveving the sum if all values
Shaynaynay
let A1,A2 and A3 events be independent,show that (A1)^c, (A2)^c and (A3)^c are independent?
Fisaye Reply
what is statistics
Akhisani Reply
data collected all over the world
Shaynaynay
construct a less than and more than table
Imad Reply
The sample of 16 students is taken. The average age in the sample was 22 years with astandard deviation of 6 years. Construct a 95% confidence interval for the age of the population.
Aschalew Reply
Bhartdarshan' is an internet-based travel agency wherein customer can see videos of the cities they plant to visit. The number of hits daily is a normally distributed random variable with a mean of 10,000 and a standard deviation of 2,400 a. what is the probability of getting more than 12,000 hits? b. what is the probability of getting fewer than 9,000 hits?
Akshay Reply
Bhartdarshan'is an internet-based travel agency wherein customer can see videos of the cities they plan to visit. The number of hits daily is a normally distributed random variable with a mean of 10,000 and a standard deviation of 2,400. a. What is the probability of getting more than 12,000 hits
Akshay
1
Bright
Sorry i want to learn more about this question
Bright
Someone help
Bright
a= 0.20233 b=0.3384
Sufiyan
a
Shaynaynay
How do I interpret level of significance?
Mohd Reply
It depends on your business problem or in Machine Learning you could use ROC- AUC cruve to decide the threshold value
Shivam
how skewness and kurtosis are used in statistics
Owen Reply
yes what is it
Taneeya
Got questions? Join the online conversation and get instant answers!
Jobilize.com Reply

Get Jobilize Job Search Mobile App in your pocket Now!

Get it on Google Play Download on the App Store Now


Source:  OpenStax, Principles of economics. OpenStax CNX. Sep 19, 2014 Download for free at http://legacy.cnx.org/content/col11613/1.11
Google Play and the Google Play logo are trademarks of Google Inc.

Notification Switch

Would you like to follow the 'Principles of economics' conversation and receive update notifications?

Ask