<< Chapter < Page Chapter >> Page >
This module breaks down a standard neural network, describing the different parameters, hyper-parameters, and functions that are necessary for building a neural network.

Cost functions

The different cost functions we explored using were the sigmoid function, rectified linear units (ReLU), and the softmax normalization function.

Sigmoid function

sigmoid
Equation for the sigmoid activation function

The sigmoid activation function is the most general nonlinear activation function used in neural networks. Intuition would naively suggest that the activation of a neuron would be well modeled by the step function, but the issue is its non-differentiability. The stochastic gradient descent algorithm requires that activation functions be differentiable. The solution would be to approximate the step function using a smooth function like the sigmoid or the hyperbolic tangent. The issue with the sigmoid function is that its derivative far from the origin is near zero, so if any individual weight on a neuron is very wrong, it is unable to use the gradient to adjust its value. As a result, outlier weights can significantly impact the performance of the network.

Rectified linear units

relu
Equation for the ReLU activation function

The advantage of using rectified linear units is threefold. First, its derivative is a constant (either 0 or 1) making the computation of the gradient much faster. Second, it is a better approximation of how biological neurons fire, in the sense that there is no activation in the absence of stimulation. Third, rectified linear units speed up learning by not being able to fire with zero net excitation. This means that if an excitation fails to overcome a neuron’s bias, the neuron will not fire at all. And when it does fire, the activation is linearly proportional to the excitation. The sigmoid function in comparison allows for some activation to occur with zero and even negative net excitation. However, a lower learning rate needs to be used with ReLU because its zero derivative for a net excitation less than zero means that the neuron effectively stops learning once its net excitation hits zero.

Softmax

softmax
Equation for the softmax activation function

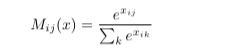
Softmax activation is particularly useful on the output layer, as it normalizes the output. Exponentiating each of the net excitations gives a more dramatic representation of the differences between them. Weak excitations become weaker activations and strong excitations become stronger activations. Everything is then normalized, giving the layer the effect of becoming a decision-maker.

Activation functions

The different cost functions we explored using for the gradient descent learning algorithm were mean-squared error, cross-entropy, and log-likelihood.

Mean-squared error

mse
Equation for the mean-squared error cost function

Mean-squared error is the simplest measurement of difference that can be used to good effect in a neural network. It can be used with any activation function and is the more versatile option, though not always the most effective one. One of its shortcomings is that neurons with a sigmoid activation function become saturated quickly and are unable to learn more as a result of the relatively small magnitude of the sigmoid’s derivative far from the origin.

Cross-entropy

entropy
Equation for the cross-entropy cost function

Cross-entropy treats the desired output as some probability distribution and the network’s output as another probability distribution, and measures the distance between the distributions. The main attraction to using cross-entropy is that when used in conjunction with the sigmoid activation function, its gradient is linearly dependent on the error, solving the issue with neurons becoming saturated quickly.

Log-likelihood

log
Equation for the log-likelihood cost function

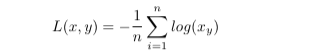
Log likelihood maximizes only the output neuron corresponding to which neuron should be firing. Used in conjunction with a softmax layer, all other output neurons would be minimized as a result of maximizing the desired output neuron. In this sense, a softmax layer has to be used, or the activations of the final layer will be too close together to draw meaningful conclusions.

Stochastic gradient descent

Stochastic gradient descent

sgd
Equation for the SGD learning algorithm, applied to both the weights and biases.

Stochastic gradient descent is the algorithm used in our network to adjust weights and biases according to the evaluation of the gradient of a given cost function. The gradient determines whether a parameter should increase or decrease and by how much. The learning rate of a network is a constant associated with how much a parameter should travel down its gradient at each reevaluation. In the original algorithm, parameters are updated after each given input. A common practice with neural nets is to only reevaluate the gradient after a so-called minibatch of multiple inputs is passed. This way, the cost function has multiple samples and can better construct a curve, yet the gradient is somewhat different every time it’s evaluated. This introduces some noise into the gradient to make it harder for parameters to get stuck in a local minimum of the gradient.

Dropout

Overfitting is an issue experienced in networks when neurons are trained to identify specific images in a training set rather than the more general concept that an image represents. Instead of recognizing a 7, the network may only recognize the particular 7s that were in the training data set. To prevent this, we implemented dropout in our network. Random neurons in our interconnected layers were turned off between mini-batches, meaning that certain weights were not able to be used in determining an output. This essentially means that we were training a slightly different network each mini-batch, encouraging more neurons to learn meaningfully, as weights will typically be more fairly distributed. In evaluating the network, all neurons are turned back on and their weights are scaled down by the dropout rate. As a result, neurons are less strongly associated with particular images, and more applicable to a more expansive set of images.

Questions & Answers

differentiate between demand and supply giving examples
Lambiv Reply
differentiated between demand and supply using examples
Lambiv
what is labour ?
Lambiv
how will I do?
Venny Reply
how is the graph works?I don't fully understand
Rezat Reply
information
Eliyee
devaluation
Eliyee
t
WARKISA
hi guys good evening to all
Lambiv
multiple choice question
Aster Reply
appreciation
Eliyee
explain perfect market
Lindiwe Reply
In economics, a perfect market refers to a theoretical construct where all participants have perfect information, goods are homogenous, there are no barriers to entry or exit, and prices are determined solely by supply and demand. It's an idealized model used for analysis,
Ezea
What is ceteris paribus?
Shukri Reply
other things being equal
AI-Robot
When MP₁ becomes negative, TP start to decline. Extuples Suppose that the short-run production function of certain cut-flower firm is given by: Q=4KL-0.6K2 - 0.112 • Where is quantity of cut flower produced, I is labour input and K is fixed capital input (K-5). Determine the average product of lab
Kelo
Extuples Suppose that the short-run production function of certain cut-flower firm is given by: Q=4KL-0.6K2 - 0.112 • Where is quantity of cut flower produced, I is labour input and K is fixed capital input (K-5). Determine the average product of labour (APL) and marginal product of labour (MPL)
Kelo
yes,thank you
Shukri
Can I ask you other question?
Shukri
what is monopoly mean?
Habtamu Reply
What is different between quantity demand and demand?
Shukri Reply
Quantity demanded refers to the specific amount of a good or service that consumers are willing and able to purchase at a give price and within a specific time period. Demand, on the other hand, is a broader concept that encompasses the entire relationship between price and quantity demanded
Ezea
ok
Shukri
how do you save a country economic situation when it's falling apart
Lilia Reply
what is the difference between economic growth and development
Fiker Reply
Economic growth as an increase in the production and consumption of goods and services within an economy.but Economic development as a broader concept that encompasses not only economic growth but also social & human well being.
Shukri
production function means
Jabir
What do you think is more important to focus on when considering inequality ?
Abdisa Reply
any question about economics?
Awais Reply
sir...I just want to ask one question... Define the term contract curve? if you are free please help me to find this answer 🙏
Asui
it is a curve that we get after connecting the pareto optimal combinations of two consumers after their mutually beneficial trade offs
Awais
thank you so much 👍 sir
Asui
In economics, the contract curve refers to the set of points in an Edgeworth box diagram where both parties involved in a trade cannot be made better off without making one of them worse off. It represents the Pareto efficient allocations of goods between two individuals or entities, where neither p
Cornelius
In economics, the contract curve refers to the set of points in an Edgeworth box diagram where both parties involved in a trade cannot be made better off without making one of them worse off. It represents the Pareto efficient allocations of goods between two individuals or entities,
Cornelius
Suppose a consumer consuming two commodities X and Y has The following utility function u=X0.4 Y0.6. If the price of the X and Y are 2 and 3 respectively and income Constraint is birr 50. A,Calculate quantities of x and y which maximize utility. B,Calculate value of Lagrange multiplier. C,Calculate quantities of X and Y consumed with a given price. D,alculate optimum level of output .
Feyisa Reply
Answer
Feyisa
c
Jabir
the market for lemon has 10 potential consumers, each having an individual demand curve p=101-10Qi, where p is price in dollar's per cup and Qi is the number of cups demanded per week by the i th consumer.Find the market demand curve using algebra. Draw an individual demand curve and the market dema
Gsbwnw Reply
suppose the production function is given by ( L, K)=L¼K¾.assuming capital is fixed find APL and MPL. consider the following short run production function:Q=6L²-0.4L³ a) find the value of L that maximizes output b)find the value of L that maximizes marginal product
Abdureman
types of unemployment
Yomi Reply
What is the difference between perfect competition and monopolistic competition?
Mohammed
Got questions? Join the online conversation and get instant answers!
Jobilize.com Reply

Get Jobilize Job Search Mobile App in your pocket Now!

Get it on Google Play Download on the App Store Now


Source:  OpenStax, Elec 301 projects fall 2015. OpenStax CNX. Jan 04, 2016 Download for free at https://legacy.cnx.org/content/col11950/1.1
Google Play and the Google Play logo are trademarks of Google Inc.

Notification Switch

Would you like to follow the 'Elec 301 projects fall 2015' conversation and receive update notifications?

Ask