<< Chapter < Page Chapter >> Page >

Graphical representation of measures of central tendency and dispersion

The measures of central tendency (mean, median, mode) and the measures of dispersion (range, semi-inter-quartile range, quartiles, percentiles, inter-quartile range) are numerical methods of summarising data. This section presents methods of representing the summarised data using graphs.

Five number summary

One method of summarising a data set is to present a five number summary . The five numbers are: minimum, first quartile, median, third quartile and maximum.

Box and whisker diagrams

A box and whisker diagram is a method of depicting the five number summary, graphically.

The main features of the box and whisker diagram are shown in [link] . The box can lie horizontally (as shown) or vertically. For a horizonatal diagram, the left edge of the box is placed at the first quartile and the right edge of the box is placed at the third quartile. The height of the box is arbitrary, as there is no y -axis. Inside the box there is some representation of central tendency, with the median shown with a vertical line dividing the box into two. Additionally, a star or asterix is placed at the mean value, centered in the box in the vertical direction. The whiskers which extend to the sides reach the minimum and maximum values.

Draw a box and whisker diagram for the data set

x = { 1 , 25 ; 1 , 5 ; 2 , 5 ; 2 , 5 ; 3 , 1 ; 3 , 2 ; 4 , 1 ; 4 , 25 ; 4 , 75 ; 4 , 8 ; 4 , 95 ; 5 , 1 } .

  1. Minimum = 1,25

    Maximum = 5,10

    Position of first quartile = between 3 and 4

    Position of second quartile = between 6 and 7

    Position of third quartile = between 9 and 10

    Data value between 3 and 4 = 1 2 ( 2 , 5 + 2 , 5 ) = 2 , 5

    Data value between 6 and 7 = 1 2 ( 3 , 2 + 4 , 1 ) = 3 , 65

    Data value between 9 and 10 = 1 2 ( 4 , 75 + 4 , 8 ) = 4 , 775

    The five number summary is therefore: 1,25; 2,5; 3,65; 4,775; 5,10.

Khan academy video on box and whisker plots

Box and whisker plots

  1. Lisa works as a telesales person. She keeps a record of the number of sales she makes each month. The data below show how much she sells each month. 49; 12; 22; 35; 2; 45; 60; 48; 19; 1; 43; 12 Give a five number summary and a box and whisker plot of her sales.
  2. Jason is working in a computer store. He sells the following number of computers each month: 27; 39; 3; 15; 43; 27; 19; 54; 65; 23; 45; 16 Give a five number summary and a box and whisker plot of his sales,
  3. The number of rugby matches attended by 36 season ticket holders is as follows: 15; 11; 7; 34; 24; 22; 31; 12; 9 12; 9; 1; 3; 15; 5; 8; 11; 2 25; 2; 6; 18; 16; 17; 20; 13; 17 14; 13; 11; 5; 3; 2; 23; 26; 40
    1. Sum the data.
    2. Using an appropriate graphical method (give reasons) represent the data.
    3. Find the median, mode and mean.
    4. Calculate the five number summary and make a box and whisker plot.
    5. What is the variance and standard deviation?
    6. Comment on the data's spread.
    7. Where are 95% of the results expected to lie?
  4. Rose has worked in a florists shop for nine months. She sold the following number of wedding bouquets: 16; 14; 8; 12; 6; 5; 3; 5; 7
    1. What is the five-number summary of the data?
    2. Since there is an odd number of data points what do you observe when calculating the five-numbers?

Cumulative histograms

Cumulative histograms, also known as ogives, are a plot of cumulative frequency and are used to determine how many data values lie above or below a particular value in a data set. The cumulative frequency is calculated from a frequency table, by adding each frequency to the total of the frequencies of all data values before it in the data set. The last value for the cumulative frequency will always be equal to the total number of data values, since all frequencies will already have been added to the previous total. The cumulative frequency is plotted at the upper limit of the interval.

For example, the cumulative frequencies for Data Set 2 are shown in [link] and is drawn in [link] .

Cumulative Frequencies for Data Set 2.
Intervals 0 < n 1 1 < n 2 2 < n 3 3 < n 4 4 < n 5 5 < n 6
Frequency 30 32 35 34 37 32
Cumulative Frequency 30 30 + 32 30 + 32 + 35 30 + 32 + 35 + 34 30 + 32 + 35 + 34 + 37 30 + 32 + 35 + 34 + 37 + 32
30 62 97 131 168 200

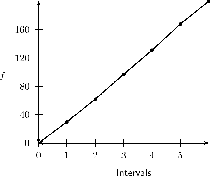
Notice the frequencies plotted at the upper limit of the intervals, so the points (30;1) (62;2) (97;3), etc have been plotted. This is different from the frequency polygon where we plot frequencies at the midpoints of the intervals.

Intervals

  1. Use the following data of peoples ages to answer the questions. 2; 5; 1; 76; 34; 23; 65; 22; 63; 45; 53; 384; 28; 5; 73; 80; 17; 15; 5; 34; 37; 45; 56
    1. Using an interval width of 8 construct a cumulative frequency distribution
    2. How many are below 30?
    3. How many are below 60?
    4. Giving an explanation state below what value the bottom 50% of the ages fall
    5. Below what value do the bottom 40% fall?
    6. Construct a frequency polygon and an ogive.
    7. Compare these two plots
  2. The weights of bags of sand in grams is given below (rounded to the nearest tenth): 50,1; 40,4; 48,5; 29,4; 50,2; 55,3; 58,1; 35,3; 54,2; 43,560,1; 43,9; 45,3; 49,2; 36,6; 31,5; 63,1; 49,3; 43,4; 54,1
    1. Decide on an interval width and state what you observe about your choice.
    2. Give your lowest interval.
    3. Give your highest interval.
    4. Construct a cumultative frequency graph and a frequency polygon.
    5. Compare the cumulative frequency graph and frequency polygon.
    6. Below what value do 53% of the cases fall?
    7. Below what value fo 60% of the cases fall?

Get Jobilize Job Search Mobile App in your pocket Now!

Get it on Google Play Download on the App Store Now


Source:  OpenStax, Siyavula textbooks: grade 11 maths. OpenStax CNX. Aug 03, 2011 Download for free at http://cnx.org/content/col11243/1.3
Google Play and the Google Play logo are trademarks of Google Inc.

Notification Switch

Would you like to follow the 'Siyavula textbooks: grade 11 maths' conversation and receive update notifications?

Ask