<< Chapter < Page Chapter >> Page >
This module examines the properties of the continuous Uniform probability distribution, which describes a set of continuous data for which all intervals of values having the same length are equally likely. This revision is based on the original module m16819 in the textbook collection Collaborative Statistics by S. Dean and Dr. B. Illowsky; the last example in the original module was replaced with a new example.

Illustrate the uniform distribution . The data that follows are a random sample of 55 smiling times, in seconds, of an eight-week old baby.

10.4 19.6 18.8 13.9 17.8 16.8 21.6 17.9 12.5 11.1 4.9
12.8 14.8 22.8 20.0 15.9 16.3 13.4 17.1 14.5 19.0 22.8
1.3 0.7 8.9 11.9 10.9 7.3 5.9 3.7 17.9 19.2 9.8
5.8 6.9 2.6 5.8 21.7 11.8 3.4 2.1 4.5 6.3 10.7
8.9 9.4 9.4 7.6 10.0 3.3 6.7 7.8 11.6 13.8 18.6

sample mean = 11.49 and sample standard deviation = 6.23

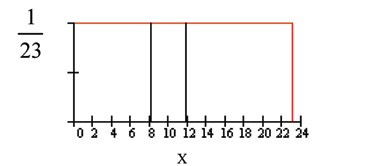
We will assume that the sample of smiling times is drawn from a population that follows a uniform distribution between 0 and 23 seconds. This means that any smiling time between 0 and 23 seconds is equally likely.

Let X = length of time, in seconds, of an eight-week old's smile.

The notation for the uniform distribution is

X ~ U ( a, b ) where a = the lowest value and b = the highest value.

For this example, X ~ U ( 0, 23 ) . 0 X 23 .

Formulas for the theoretical mean and standard deviation are

μ a + b 2 and σ ( b - a ) 2 12

For this problem, the theoretical mean and standard deviation are

μ 0 + 23 2 11.50 seconds and σ ( 23 - 0 ) 2 12 6.64 seconds

Notice that the theoretical mean and standard deviation are close to the sample mean and standard deviation.

To find f X : f X 1 23 - 0 1 23

What is the probability that a randomly chosen eight-week old smiles between 2 and 18 seconds?

Find P ( 2 X 18 ) .

P ( 2 X 18 ) ( base ) ( height ) ( 18 - 2 ) 1 23 16 23 .

f(X) graph displaying a boxed region consisting of a horizontal line extending to the right from midway on the y-axis, a vertical upward line from point 23 on the x-axis, and the x and y-axes. A shaded region from points 2-18 occurs within this area.

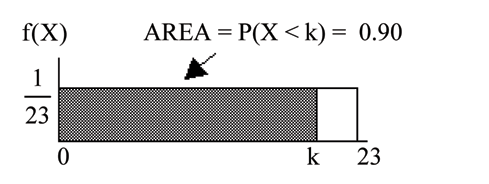
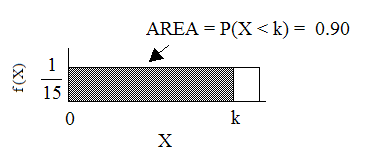
Find the 90th percentile for an eight week old's smiling time.

Ninety percent of the smiling times fall below the 90th percentile, k , so P ( X k ) 0.90

P ( X k ) 0.90

( base ) ( height ) = 0.90

( k - 0 ) 1 23 = 0.90

k 23 0.90 20.7

f(X)=1/23 graph displaying a boxed region consisting of a horizontal line extending to the right from point 1/23 on the y-axis, a vertical upward line from point 23 on the x-axis, and the x and y-axes. A shaded region from points 0-k occurs within this area. The shaded region probability area is equal to 0.90.

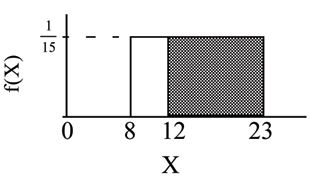
Find the probability that a random eight week old smiles more than 12 seconds KNOWING that the baby smiles MORE THAN 8 SECONDS .

Find P ( X 12 | X 8 ) There are two ways to do the problem. For the first way , use the fact that this is a conditional and changes the sample space. The graph illustrates the new sample space. You already know the baby smiled morethan 8 seconds.

Write a new f X : f X 1 23 - 8 1 15

for 8 X 23

P ( X 12 | X 8 ) ( 23 - 12 ) 1 15 11 15

f(X)=1/15 graph displaying a boxed region consisting of a horizontal line extending to the right from point 1/15 on the y-axis, a vertical upward line from points 8 and 23 on the x-axis, and the x-axis. A shaded region from points 12-23 occurs within this area.

For the second way, use the conditional formula from Chapter 3 with the original distribution X ~ U ( 0 , 23 ) :

P ( A | B ) = P ( A AND B ) P ( B ) For this problem, A is ( X 12 ) and B is ( X 8 ) .

So, P ( X 12 | X 8 ) ( X > 12 AND X > 8 ) P ( X 8 ) P ( X 12 ) P ( X 8 ) 11 23 15 23 0.733

f(X)=1/23 graph displaying a conditional boxed region consisting of a horizontal red line extending to the right from point 1/23 on the y-axis, a vertical red upward line from point 23 on the x-axis, and the x and y-axes. Two vertical upward lines from points 8 and 12 on the x-axis occur within this area.

Uniform : The amount of time, in minutes, that a person must wait for a bus is uniformly distributed between 0 and 15 minutes.

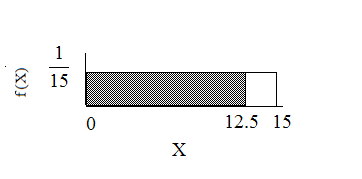
What is the probability that a person waits fewer than 12.5 minutes?

Let X = the number of minutes a person must wait for a bus. a = 0 and b = 15. X ~ U ( 0 , 15 ) . Write the probability density function. f X = 1 15 - 0 = 1 15 for 0 X 15

Find P ( X 12.5 ) . Draw a graph.

P ( X k ) ( base ) ( height ) = ( 12.5 - 0 ) 1 15 = 0.8333

The probability a person waits less than 12.5 minutes is 0.8333.

f(X)=1/15 graph displaying a boxed region consisting of a horizontal line extending to the right from point 1/15 on the y-axis, a vertical upward line from point 15 on the x-axis, and the x and y-axes. A shaded region from points 0-12.5 occurs within this area.

On the average, how long must a person wait?

Find the mean, μ , and the standard deviation, σ .

μ = a + b 2 = 15 + 0 2 = 7.5 . On the average, a person must wait 7.5 minutes.

σ = ( b - a ) 2 12 = ( 15 - 0 ) 2 12 = 4.3 . The Standard deviation is 4.3 minutes.

Ninety percent of the time, the time a person must wait falls below what value?

This asks for the 90th percentile.

Find the 90th percentile. Draw a graph. Let k = the 90th percentile.

P ( X k ) ( base ) ( height ) = ( k - 0 ) ( 1 15 )

0.90 = k 1 15

k = (0.90)(15) = 13.5

k is sometimes called a critical value.

The 90th percentile is 13.5 minutes. Ninety percent of the time, a person must wait at most 13.5 minutes.

f(X)=1/15 graph displaying a boxed region consisting of a horizontal line extending to the right from point 1/15 on the y-axis, a vertical upward line from an arbitrary point on the x-axis, and the x and y-axes. A shaded region from points 0-k occurs within this area. The area of this probability region is equal to 0.90.

Uniform : Ace Heating and Air Conditioning Service finds that the amount of time a repairman needs to fix a furnace is uniformly distributed between 1.5 and 4 hours. Let X = the time needed to fix a furnace. Then X ~ U ( 1.5 , 4 ) .

  1. Find the problem that a randomly selected furnace repair requires more than 2 hours.
  2. Find the probability that a randomly selected furnace repair requires less than 3 hours.
  3. Find the 30th percentile of furnace repair times.
  4. The longest 25% of repair furnace repairs take at least how long? (In other words: Find the minimum time for the longest 25% of repair times.) What percentile does this represent?
  5. Find the mean and standard deviation

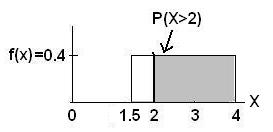
Find the probability that a randomly selected furnace repair requires longer than 2 hours.

To find f X : f X 1 4 - 1.5 1 2.5 so f X 0.4

P(X>2) = (base)(height) = (4 − 2)(0.4) = 0.8

Example 4 figure 1

Uniform Distribution between 1.5 and 4 with shaded area between 2 and 4 representing the probability that the repair time X is greater than 2

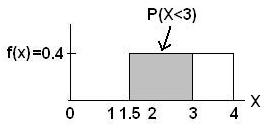
Find the probability that a randomly selected furnace repair requires less than 3 hours. Describe how the graph differs from the graph in the first part of this example.

P ( X 3 ) = (base)(height) = (3 − 1.5)(0.4) = 0.6

The graph of the rectangle showing the entire distribution would remain the same. However the graph should be shaded between X=1.5 and X=3. Note that the shaded area starts at X=1.5 rather than at X=0; since X~U(1.5,4), X can not be less than 1.5.

Example 4 figure 2

Uniform Distribution between 1.5 and 4 with shaded area between 1.5 and 3 representing the probability that the repair time X is less than 3

Find the 30th percentile of furnace repair times.

Example 4 figure 3

Uniform Distribution between 1.5 and 4 with an area of 0.30 shaded to the left, representing the shortest 30% of repair times.

P ( X k ) 0.30

P ( X k ) ( base ) ( height ) = ( k - 1.5 ) ( 0.4 )

  • 0.3 = (k − 1.5) (0.4) ; Solve to find k:
  • 0.75 = k − 1.5 , obtained by dividing both sides by 0.4
  • k = 2.25 , obtained by adding 1.5 to both sides

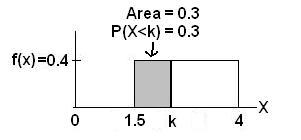
The 30th percentile of repair times is 2.25 hours. 30% of repair times are 2.5 hours or less.

The longest 25% of furnace repair times take at least how long? (Find the minimum time for the longest 25% of repairs.)

Example 4 figure 4

Uniform Distribution between 1.5 and 4 with an area of 0.25 shaded to the right representing the longest 25% of repair times.

P ( X k ) 0.25

P ( X k ) ( base ) ( height ) = ( 4 - k ) ( 0.4 )

  • 0.25 = (4 − k)(0.4) ; Solve for k:
  • 0.625 = 4 − k , obtained by dividing both sides by 0.4
  • −3.375 = −k , obtained by subtracting 4 from both sides
  • k=3.375

The longest 25% of furnace repairs take at least 3.375 hours (3.375 hours or longer).

Note: Since 25% of repair times are 3.375 hours or longer, that means that 75% of repair times are 3.375 hours or less. 3.375 hours is the 75th percentile of furnace repair times.

Find the mean and standard deviation

μ a + b 2 and σ ( b - a ) 2 12

μ 1.5 + 4 2 2.75 hours and σ ( 4 - 1.5 ) 2 12 0.7217 hours

Questions & Answers

What are the factors that affect demand for a commodity
Florence Reply
differentiate between demand and supply giving examples
Lambiv Reply
differentiated between demand and supply using examples
Lambiv
what is labour ?
Lambiv
how will I do?
Venny Reply
how is the graph works?I don't fully understand
Rezat Reply
information
Eliyee
devaluation
Eliyee
t
WARKISA
hi guys good evening to all
Lambiv
multiple choice question
Aster Reply
appreciation
Eliyee
explain perfect market
Lindiwe Reply
In economics, a perfect market refers to a theoretical construct where all participants have perfect information, goods are homogenous, there are no barriers to entry or exit, and prices are determined solely by supply and demand. It's an idealized model used for analysis,
Ezea
What is ceteris paribus?
Shukri Reply
other things being equal
AI-Robot
When MP₁ becomes negative, TP start to decline. Extuples Suppose that the short-run production function of certain cut-flower firm is given by: Q=4KL-0.6K2 - 0.112 • Where is quantity of cut flower produced, I is labour input and K is fixed capital input (K-5). Determine the average product of lab
Kelo
Extuples Suppose that the short-run production function of certain cut-flower firm is given by: Q=4KL-0.6K2 - 0.112 • Where is quantity of cut flower produced, I is labour input and K is fixed capital input (K-5). Determine the average product of labour (APL) and marginal product of labour (MPL)
Kelo
yes,thank you
Shukri
Can I ask you other question?
Shukri
what is monopoly mean?
Habtamu Reply
What is different between quantity demand and demand?
Shukri Reply
Quantity demanded refers to the specific amount of a good or service that consumers are willing and able to purchase at a give price and within a specific time period. Demand, on the other hand, is a broader concept that encompasses the entire relationship between price and quantity demanded
Ezea
ok
Shukri
how do you save a country economic situation when it's falling apart
Lilia Reply
what is the difference between economic growth and development
Fiker Reply
Economic growth as an increase in the production and consumption of goods and services within an economy.but Economic development as a broader concept that encompasses not only economic growth but also social & human well being.
Shukri
production function means
Jabir
What do you think is more important to focus on when considering inequality ?
Abdisa Reply
any question about economics?
Awais Reply
sir...I just want to ask one question... Define the term contract curve? if you are free please help me to find this answer 🙏
Asui
it is a curve that we get after connecting the pareto optimal combinations of two consumers after their mutually beneficial trade offs
Awais
thank you so much 👍 sir
Asui
In economics, the contract curve refers to the set of points in an Edgeworth box diagram where both parties involved in a trade cannot be made better off without making one of them worse off. It represents the Pareto efficient allocations of goods between two individuals or entities, where neither p
Cornelius
In economics, the contract curve refers to the set of points in an Edgeworth box diagram where both parties involved in a trade cannot be made better off without making one of them worse off. It represents the Pareto efficient allocations of goods between two individuals or entities,
Cornelius
Suppose a consumer consuming two commodities X and Y has The following utility function u=X0.4 Y0.6. If the price of the X and Y are 2 and 3 respectively and income Constraint is birr 50. A,Calculate quantities of x and y which maximize utility. B,Calculate value of Lagrange multiplier. C,Calculate quantities of X and Y consumed with a given price. D,alculate optimum level of output .
Feyisa Reply
Answer
Feyisa
c
Jabir
the market for lemon has 10 potential consumers, each having an individual demand curve p=101-10Qi, where p is price in dollar's per cup and Qi is the number of cups demanded per week by the i th consumer.Find the market demand curve using algebra. Draw an individual demand curve and the market dema
Gsbwnw Reply
suppose the production function is given by ( L, K)=L¼K¾.assuming capital is fixed find APL and MPL. consider the following short run production function:Q=6L²-0.4L³ a) find the value of L that maximizes output b)find the value of L that maximizes marginal product
Abdureman
Got questions? Join the online conversation and get instant answers!
Jobilize.com Reply
Practice Key Terms 2

Get Jobilize Job Search Mobile App in your pocket Now!

Get it on Google Play Download on the App Store Now


Source:  OpenStax, Collaborative statistics: custom version modified by r. bloom. OpenStax CNX. Nov 15, 2010 Download for free at http://legacy.cnx.org/content/col10617/1.4
Google Play and the Google Play logo are trademarks of Google Inc.

Notification Switch

Would you like to follow the 'Collaborative statistics: custom version modified by r. bloom' conversation and receive update notifications?

Ask