This module discusses the graphing of exponential curves.
By plotting points, you can discover that the graph of
looks like this:
A few points to notice about this graph.
It goes through the point
because
.
It never dips below the
-axis. The
domain is unlimited, but the
range is y>0. (*Think about our definitions of exponents: whether
is positive or negative, integer or fraction,
is
always positive.)
Every time you move one unit to the right, the graph height doubles. For instance,
is twice
, because it multiplies by
one more 2. So as you move to the right, the
-values start looking like 8, 16, 32, 64, 128, and so on, going up more and more sharply.
Conversely, every time you move one unit to the left, the graph height drops in half. So as you move to the left, the
-values start looking like
,
,
, and so on, falling closer and closer to 0.
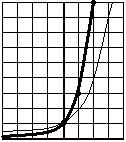
What would the graph of
look like? Of course, it would also go through
because
. With each step to the right, it would
triple ; with each step to the left, it would drop in a
third . So the overall shape would look similar, but the rise (on the right) and the drop (on the left) would be faster.
in thin line;
in thick line;
They cross at
As you might guess, graphs such as
and
all have this same characteristic shape. In fact, any graph
where
will look basically the same: starting at
it will rise more and more sharply on the right, and drop toward zero on the left. This type of graph models
exponential growth —functions that keep multiplying by the same number. A common example, which you work through in the text, is compound interest from a bank.
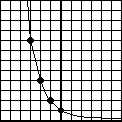
The opposite graph is
.
Each time you move to the right on this graph, it multiplies by
: in other words, it
divides by 2, heading closer to zero the further you go. This kind of equation is used to model functions that keep
dividing by the same number; for instance, radioactive decay. You will also be working through examples like this one.
Of course, all the
permutations from the first chapter on “functions” apply to these graphs just as they apply to any graph. A particularly interesting example is
. Remember that when you replace
with
,
becomes the old
and vice-versa; in other words, the graph flips around the
-axis. If you take the graph of
and permute it in this way, you get a familiar shape:
Yes, it’s
in a new disguise!
Why did it happen that way? Consider that
. But
is just 1 (in other words, 1 to the
anything is 1), so
. But negative exponents go in the denominator:
is the same thing as
! So we arrive at:
. The two functions are the same, so their graphs are of course the same.
Another fun pair of permutations is:
Looks just likebut vertically stretched: all y-values double
Looks just likebut horizontally shifted: moves 1 to the left
If you permute
in these two ways, you will find that they create the same graph.