| << Chapter < Page | Chapter >> Page > |
The golf scores for a school team were normally distributed with a mean of 68 and a standard deviation of three.
Find the probability that a randomly selected golfer scored less than 65.
A personal computer is used for office work at home, research, communication, personal finances, education, entertainment, social networking, and a myriad of other things. Suppose that the average number of hours a household personal computer is used for entertainment is two hours per day. Assume the times for entertainment are normally distributed and the standard deviation for the times is half an hour.
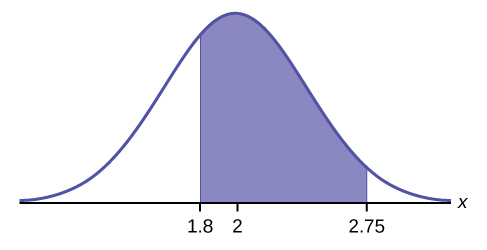
a. Find the probability that a household personal computer is used for entertainment between 1.8 and 2.75 hours per day.
a. Let X = the amount of time (in hours) a household personal computer is used for entertainment. X ~ N (2, 0.5) where μ = 2 and σ = 0.5.
Find P (1.8< x <2.75).
The probability for which you are looking is the area between x = 1.8 and x = 2.75. P (1.8< x <2.75) = 0.5886

The probability that a household personal computer is used between 1.8 and 2.75 hours per day for entertainment is 0.5886.
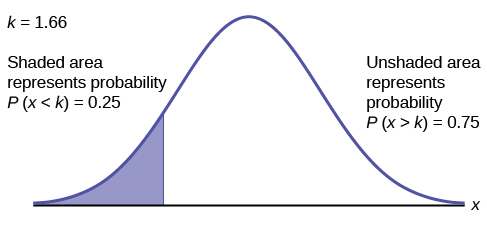
b. Find the maximum number of hours per day that the bottom quartile of households uses a personal computer for entertainment.
b. To find the maximum number of hours per day that the bottom quartile of households uses a personal computer for entertainment, find the 25 th percentile, k , where P ( x < k ) = 0.25.

The maximum number of hours per day that the bottom quartile of households uses a personal computer for entertainment is 1.66 hours.
The golf scores for a school team were normally distributed with a mean of 68 and a standard deviation of three. Find the probability that a golfer scored between 66 and 70.
0.4950
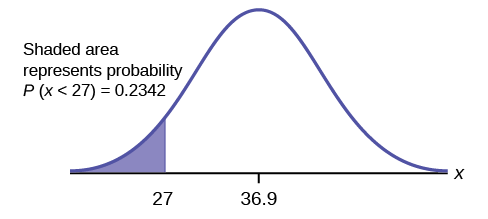
There are approximately one billion smartphone users in the world today. In the United States the ages 13 to 55+ of smartphone users approximately follow a normal distribution with approximate mean and standard deviation of 36.9 years and 13.9 years, respectively.
a. Determine the probability that a random smartphone user in the age range 13 to 55+ is between 23 and 64.7 years old.
a. 0.8186
b. Determine the probability that a randomly selected smartphone user in the age range 13 to 55+ is at most 50.8 years old.
b. 0.8413
c. Find the 80 th percentile of this distribution, and interpret it in a complete sentence.
c.
Use the information in [link] to answer the following questions.
Let X = a smart phone user whose age is 13 to 55+. X ~ N (36.9, 13.9)

There are approximately one billion smartphone users in the world today. In the United States the ages 13 to 55+ of smartphone users approximately follow a normal distribution with approximate mean and standard deviation of 36.9 years and 13.9 years respectively. Using this information, answer the following questions (round answers to one decimal place).
a. Calculate the interquartile range ( IQR ).
a.
b. Forty percent of the ages that range from 13 to 55+ are at least what age?
b.

Notification Switch
Would you like to follow the 'Statistics i - math1020 - red river college - version 2015 revision a - draft 2015-10-24' conversation and receive update notifications?