Fourier analysis of notes
Once we have the start times for each note, we know the duration of each note as well as their start and end times. We create a hamming window of length 1.25 times the length of the note of interest. The window is then used to extract out the note. The following figure illustrates this:
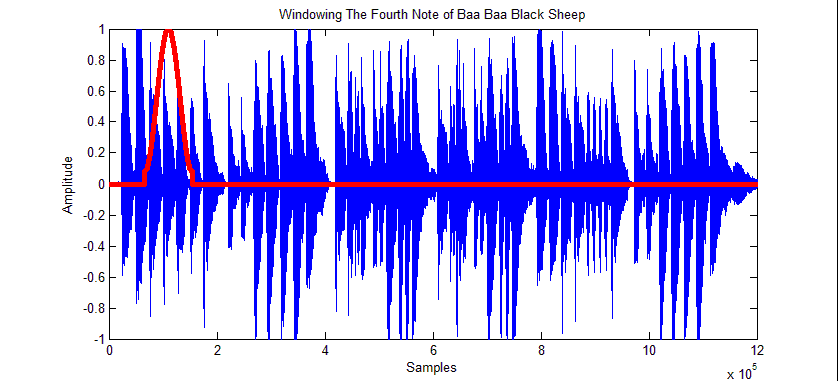
We decided to use a hamming window because it mitigates errors in the onset detection algorithm. Moreover, it doesn't allow for as many spurious oscillations in the spectrum as a rectangular window does. Changes in the spectrum are better captured.
Now that we have the signal of interest, we take its fourier transform using the fft algorithm. We use the frequency domain because the pitch of a note is determined by what frequencies it has power in, while the distribution of power among harmonics determines the sound of the instrument. E.g. 440 Hz corresponds to an "A". For an A on a piano, there will be power at 440, 880, 1320 Hz,etc, and the shape of this distribution distinguishes it from an A on a flute or guitar. We detect the frequencies with the highest power in the fft along with the corresponding power. The HPCP algorithm explained in the next module analyzes these peaks to find the probabilities of the note being anyone of the 12 pitches.
Peak detection
Peak detection refers to the detection of the peaks of the Fourier transform of each note. These correspond to the harmonics of the fundamental frequency of whatever key is being pressed. We used a MATLAB function called "findpeaks" to help us.
...A difficult part of peak detection is determining what constitutes a "peak". For our purposes, we normalized our Fourier transform plot to have a max of 1, and considered all points above a threshold to be a peak. We chose our threshold after carefully looking at the Fourier transforms of many signals.
Hamming window
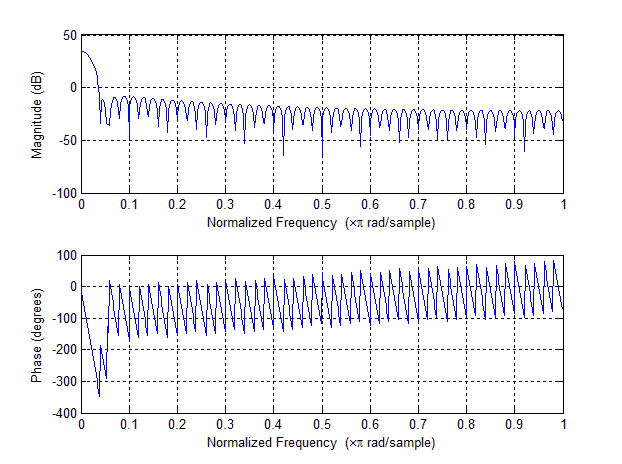
In the extraction of notes, you may ask yourself, why did we choose to using a hamming window? Why not a boxcar filter? The answer to this question is simple. Imagine the boxcar filter in the frequency domain. What do we see? We basically see a low pass filter (what we want) with lots of ripples attached to both ends of it (what we don't want). The ripples will introduce lots of error as we are letting in frequencies we do not want.
Boxcar filter

In comparison, if we look at the frequency domain of a hamming window, while there are also ripples attached to the end of our filter, the ripples are generally much smaller. While not perfect, this is highly preferable to the boxcar filter.
Hamming filter