

| << Chapter < Page | Chapter >> Page > |
This process has shown you how to set breakpoints and single-step through Java code.
What happens if you try to step
into the
process() function?
The debugger will step over the function because it is written in C.
Debugging in C is done using
ndk-gdb , which is supported in Eclipse. To do this, first terminate any existing debug session and then on the Android device, exit the current application by hitting the home button.
To configure GDB, switch back to the
C/C++ Perspective and do the following:
Run>Debug Configurations... Android NDK Application and press the
New icon, and rename the configuration to
Lab4 (1) .Android tab:
Project , hit
Browse... and select the current project.Misc. , select
Attach to the running application .Debugger tab:
GDBserver Settings tab.APK bundled GDBserver.Apply the settings and
Close .In order to launch GDB, you must first run the application on the Android device, and then attach GDB to the running application. To do this:
for loop in
process.c .Run>Run . You should see the application launch on the Android device, ignoring any Java breakpoints that you have set.Run>Debug As...>Android NDK Application . The
Debug Perspective should launch again, but this time with
gdbserver debugger . The processor will halt at the set C breakpoint.Android NDK Application does not show up, make sure that
Lab 4 is highlighted in the Project Explorer before trying to launch the debugger.In the
Expressions window, the
sb.get(0) (which is a Java method) will have generated an error as we are now debugging in C. Verify that
inBuf has the same values as the test vector look-up table by adding
inBuf[0] to the list of expressions; check several different array indices.
A useful feature that is fully supported in CCS is the ability to export processor memory to a file, which can then be imported into MATLAB for further analysis. To enable this feature in Eclipse, the lab machines have the
eVars plugin installed.
As an example, to export the
inBuf array to file:
Debug Perspective , go to
Window>Show View>Variables .inBuf pointer and select
Display as Array .Expand Variables icon multiple times until the entire array has been expanded.Export Variables icon, and save to a txt file.In the next lab, we will see how to create and write to a file on the Android device, and use
adb to download this file to the host machine, directly from MATLAB.
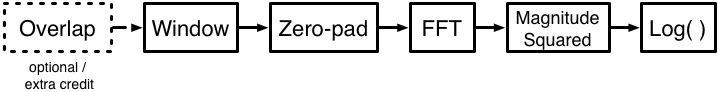
As an initial step towards implementing the spectrogram in Android, you will first implement it in MATLAB.
[link] shows the components that your spectrogram algorithm should have; the ability to overlap, while important, will be left for extra credit, and is therefore optional.
Spectrogram components
open spectrogram in the MATLAB prompt. This will open the spectrogram function you used in the Prelab.Notification Switch
Would you like to follow the 'Ece 420 spring 2014' conversation and receive update notifications?

|
|

|
|

|
|

|
|

|
|

|
|

|
|

|
|

|
|

|