

| << Chapter < Page | Chapter >> Page > |
The characteristics of a geometric experiment are:
You play a game of chance that you can either win or lose (there are no other possibilities) until you lose. Your probability of losing is . What is the probability that it takes 5 games until you lose? Let = the number of games you play until you lose (includes the losing game). Then takes on the values 1, 2, 3, ... (could go on indefinitely). The probability question is .
A safety engineer feels that 35% of all industrial accidents in her plant are caused by failure of employees to follow instructions. She decides to look at theaccident reports (selected randomly and replaced in the pile after reading) until she finds one that shows an accident caused by failure of employees to follow instructions. On the average, how many reports would the safetyengineer expect to look at until she finds a report showing an accident caused by employee failure to follow instructions? What is the probability that the safety engineerwill have to examine at least 3 reports until she finds a report showing an accident caused by employee failure to follow instructions?
Let = the number of accidents the safety engineer must examine until she finds a report showing an accident caused by employee failure to follow instructions. takes on the values 1, 2, 3, .... The first question asks you to find the expected value or the mean. The second question asks you to find . ("At least" translates as a"greater than or equal to" symbol).
Suppose that you are looking for a student at your college who lives within five miles of you. You know that 55% of the 25,000 students do live within five miles of you. You randomly contact students from the college until one says he/she lives within five miles of you. What is the probability that you need to contact four people?
This is a geometric problem because you may have a number of failures before you have the one success you desire. Also, the probability of a success stays the same each time you ask astudent if he/she lives within five miles of you. There is no definite number of trials (number of times you ask a student).
Let = the number of ____________ you must ask ____________ one says yes.
Let = the number of students you must ask until one says yes.
What values does take on?
1, 2, 3, …, (total number of students)
What are and ?
The probability question is P(_______).
~
Read this as " is a random variable with a geometric distribution." The parameter is . = the probability of a success for each trial.
Assume that the probability of a defective computer component is 0.02. Components are randomly selected. Find the probability that the first defect is caused by the 7th componenttested. How many components do you expect to test until one is found to be defective?
Let = the number of computer components tested until the first defect is found.
takes on the values 1, 2, 3, ... where . ~
Find . . (calculator or computer)
TI-83+ and TI-84: For a general discussion, see this example (binomial) . The syntax is similar. The geometric parameter list is (p, number) If "number" is left out, the result is thegeometric probability table. For this problem: After you are in 2nd DISTR, arrow down to D:geometpdf. Press ENTER. Enter .02,7). The result is .
The probability that the 7th component is the first defect is 0.0177.
The graph of ~ is:
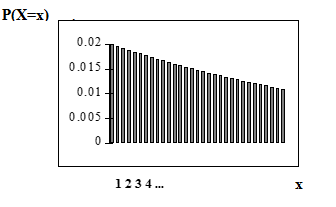
The -axis contains the probability of , where = the number of computer components tested.
The number of components that you would expect to test until you find the first defective one is the mean, = 50.
The formula for the mean is
The formula for the variance is
The standard deviation is
Notification Switch
Would you like to follow the 'Collaborative statistics: custom version modified by r. bloom' conversation and receive update notifications?

|
|

|
|

|
|

|
|

|
|

|
|

|
|

|
|

|
|

|