

| << Chapter < Page | Chapter >> Page > |
It is more likely that the amount of fishing is governed by the current number of fish present, so instead of a constant number of fish being caught, the rate is proportional to the current number of fish present, with proportionality constant as
[T] For the previous fishing problem, draw a directional field assuming Draw some solutions that exhibit this behavior. What are the equilibria and what are their stabilities?
[T] Use software or a calculator to draw directional fields for What are the nonnegative equilibria and their stabilities?
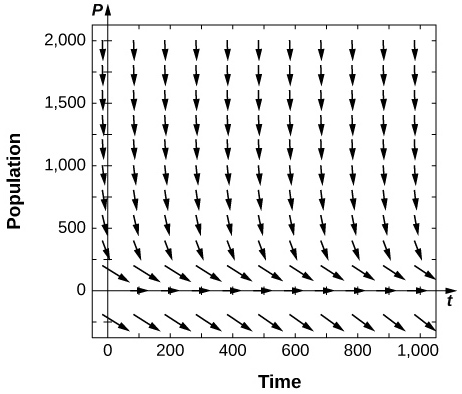
is semi-stable
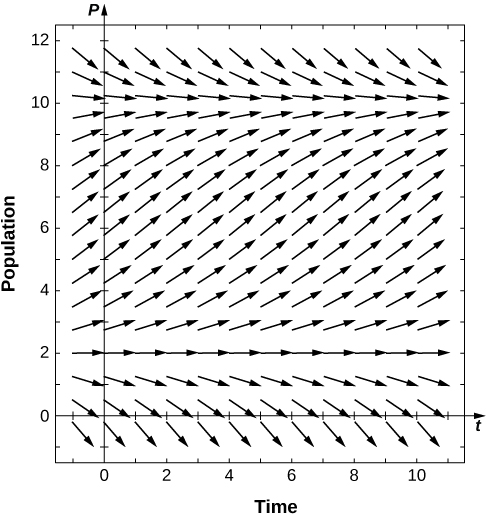
[T] Use software or a calculator to draw directional fields for What are the equilibria and their stabilities?
Solve this equation, assuming a value of and an initial condition of fish.
Solve this equation, assuming a value of and an initial condition of fish.
The following problems add in a minimal threshold value for the species to survive, which changes the differential equation to
Draw the directional field of the threshold logistic equation, assuming When does the population survive? When does it go extinct?
For the preceding problem, solve the logistic threshold equation, assuming the initial condition
Bengal tigers in a conservation park have a carrying capacity of and need a minimum of to survive. If they grow in population at a rate of per year, with an initial population of tigers, solve for the number of tigers present.
A forest containing ring-tailed lemurs in Madagascar has the potential to support individuals, and the lemur population grows at a rate of per year. A minimum of individuals is needed for the lemurs to survive. Given an initial population of lemurs, solve for the population of lemurs.
The population of mountain lions in Northern Arizona has an estimated carrying capacity of and grows at a rate of per year and there must be for the population to survive. With an initial population of mountain lions, how many years will it take to get the mountain lions off the endangered species list (at least
years months
The following questions consider the Gompertz equation , a modification for logistic growth, which is often used for modeling cancer growth, specifically the number of tumor cells.
The Gompertz equation is given by Draw the directional fields for this equation assuming all parameters are positive, and given that
Assume that for a population, and Draw the directional field associated with this differential equation and draw a few solutions. What is the behavior of the population?

Solve the Gompertz equation for generic and and
[T] The Gompertz equation has been used to model tumor growth in the human body. Starting from one tumor cell on day and assuming and a carrying capacity of million cells, how long does it take to reach “detection” stage at million cells?
days
[T] It is estimated that the world human population reached billion people in and billion in Assuming a carrying capacity of billion humans, write and solve the differential equation for logistic growth, and determine what year the population reached billion.
[T] It is estimated that the world human population reached billion people in and billion in Assuming a carrying capacity of billion humans, write and solve the differential equation for Gompertz growth, and determine what year the population reached billion. Was logistic growth or Gompertz growth more accurate, considering world population reached billion on October
September
Show that the population grows fastest when it reaches half the carrying capacity for the logistic equation
When does population increase the fastest in the threshold logistic equation
When does population increase the fastest for the Gompertz equation
Below is a table of the populations of whooping cranes in the wild from The population rebounded from near extinction after conservation efforts began. The following problems consider applying population models to fit the data. Assume a carrying capacity of cranes. Fit the data assuming years since (so your initial population at time would be cranes).
| Year (years since conservation began) | Whooping Crane Population |
|---|---|
Find the equation and parameter that best fit the data for the logistic equation.
Find the equation and parameters and that best fit the data for the threshold logistic equation.
Find the equation and parameter that best fit the data for the Gompertz equation.
Graph all three solutions and the data on the same graph. Which model appears to be most accurate?
Using the three equations found in the previous problems, estimate the population in (year after conservation). The real population measured at that time was Which model is most accurate?
Logistic: Threshold: Gompertz:
Notification Switch
Would you like to follow the 'Calculus volume 2' conversation and receive update notifications?

|
|

|
|

|
|
|
|
|

|
|

|
|
|
|
|

|
|
|
|
|

|