

| << Chapter < Page | Chapter >> Page > |
Subroutines and functions can be thought of as members of a family tree. The top of the tree, or root, is actually a routine that precedes the main routine you coded for the application. It calls your main routine, which in turn calls others, and so on, all the way down to the leaf nodes of the tree. This tree is properly known as a call graph . It doesn’t have to be a tree. Any subroutine can have more than one parent. Furthermore, recursive subroutine calls introduce cycles into the graph, in which a child calls one of its parents. The relationship between routines and nodes in the graph is one of parents and children. Nodes separated by more than one hop are referred to as ancestors and descendants.
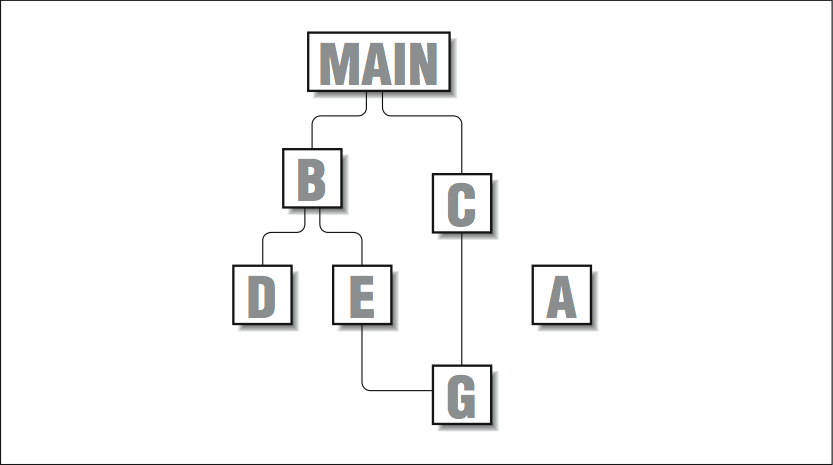
Figure 6-4 graphically depicts the kind of call graph you might see in a small application.
main is the parent or ancestor of most of the rest of the routines.
G has two parents,
E and
C . Another routine,
A , doesn’t appear to have any ancestors or descendants at all. This problem can happen when routines are not compiled with profiling enabled, or when they aren’t invoked with a subroutine call — such as would be the case if
A were an exception handler.
The UNIX profiler that can extract this kind of information is called gprof . It replicates the abilities of prof , plus it gives a call graph profile so you can see who calls whom, and how often. The call graph profile is handy if you are trying to figure out how a piece of code works or where an unknown routine came from, or if you are looking for candidates for subroutine inlining.
To use call graph profiling you need go through the same steps as with
prof , except that a
–pg flag is substituted for the
–p flag.
On HP machines, the flag is
–G . Additionally, when it comes time to produce the actual profile, you use the
gprof utility instead of
prof . One other difference is that the name of the statistics file is
gmon.out instead of
mon.out :
% cc -pg stuff.c -c
      % cc stuff.o -pg -o stuff% stuff
      % gprof stuff>stuff.gprof
The output from
gprof is divided into three sections:
The first section textually maps out the call graph. The second section lists routines, the percentage of time devoted to each, the number of calls, etc. (similar to
prof ). The third section is a cross reference so that you can locate routines by number, rather than by name. This section is especially useful for large applications because routines are sorted based on the amount of time they use, and it can be difficult to locate a particular routine by scanning for its name. Let’s invent another trivial application to illustrate how
gprof works.
[link] shows a short piece of FORTRAN code, along with a diagram of how the routines are connected together. Subroutines
A and
B are both called by
MAIN , and, in turn, each calls
C . The following example shows a section of the output from
gprof ’s call graph profile:
In the interest of conserving space, we clipped out the section most relevant to our discussion and included it in this example. There was a lot more to it, including calls of setup and system routines, the likes of which you will see when you run
gprof .
Notification Switch
Would you like to follow the 'High performance computing' conversation and receive update notifications?

|
|

|
|

|
|

|
|

|
|

|
|

|
|

|
|

|
|

|