The first part of this assignment is brought to you by our unit on
functions . In fact, this part is entirely recycled from that unit.
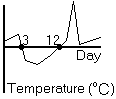
The following graph shows the temperature throughout the month of March. Actually, I just made this graph up—the numbers do not actually reflect the temperature throughout the month of March. We’re just pretending, OK?
On what days was the temperature exactly
C?
On what days was the temperature below freezing?
On what days was the temperature above freezing?
What is the domain of this graph?
During what time periods was the temperature going up?
During what time periods was the temperature going down?
OK, your memory is now officially refreshed, right? You remember how to look at a graph and see when it is zero, when it is below zero, and when it is above zero.
Now we get to the actual “quadratic inequalities” part. But the good news is, there is nothing new here! First you will graph the function (you already know how to do that). Then you will identify the region(s) where the graph is positive, or negative (you already know how to do that).
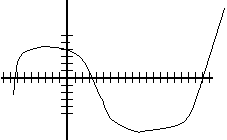
Draw a quick sketch of the graph by finding the zeros, and noting whether the function opens up or down.
Now, the inequality asks when that function is>
—that is, when it is positive. Based on your graph, for what
-values is the function positive?
Based on your answer to part (b), choose one
-value for which the inequality
should hold, and one for which it should
not . Check to make sure they both do what they should.