

| << Chapter < Page | Chapter >> Page > |
Productivity within an ecosystem can be defined as the percentage of energy entering the ecosystem incorporated into biomass in a particular trophic level. Biomass is the total mass, in a unit area at the time of measurement, of living or previously living organisms within a trophic level. Ecosystems have characteristic amounts of biomass at each trophic level. For example, in the English Channel ecosystem the primary producers account for a biomass of 4 g/m 2 (grams per meter squared), while the primary consumers exhibit a biomass of 21 g/m 2 .
The productivity of the primary producers is especially important in any ecosystem because these organisms bring energy to other living organisms by photoautotrophy or chemoautotrophy. The rate at which photosynthetic primary producers incorporate energy from the sun is called gross primary productivity . An example of gross primary productivity is shown in the compartment diagram of energy flow within the Silver Springs aquatic ecosystem as shown ( [link] ). In this ecosystem, the total energy accumulated by the primary producers (gross primary productivity) was shown to be 20,810 kcal/m 2 /yr.
Because all organisms need to use some of this energy for their own functions (like respiration and resulting metabolic heat loss) scientists often refer to the net primary productivity of an ecosystem. Net primary productivity is the energy that remains in the primary producers after accounting for the organisms’ respiration and heat loss. The net productivity is then available to the primary consumers at the next trophic level. In our Silver Spring example, 13,187 of the 20,810 kcal/m 2 /yr were used for respiration or were lost as heat, leaving 7,632 kcal/m 2 /yr of energy for use by the primary consumers.
As illustrated in [link] , large amounts of energy are lost from the ecosystem from one trophic level to the next level as energy flows from the primary producers through the various trophic levels of consumers and decomposers. The main reason for this is that in biologic systems, a great deal of energy is lost as metabolic heat when the organisms from one trophic level consume the next level. In the Silver Springs ecosystem example ( [link] ), we see that the primary consumers produced 1103 kcal/m 2 /yr from the 7618 kcal/m 2 /yr of energy available to them from the primary producers. The measurement of energy transfer efficiency between two successive trophic levels is termed the trophic level transfer efficiency (TLTE) and is typically somewhere around 10% - 15% in a given ecosystem
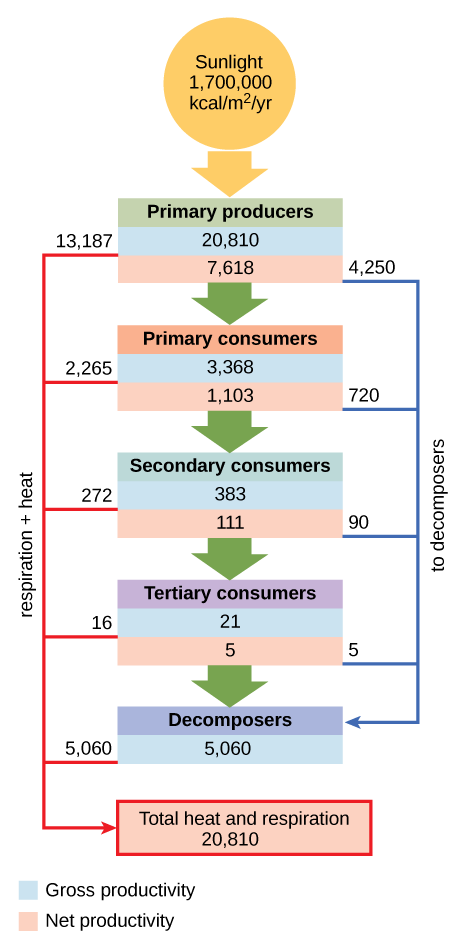
Why do you think the value for gross productivity of the primary producers is the same as the value for total heat and respiration (20,810 kcal/m 2 /yr)?
In Silver Springs, the TLTE between the first two trophic levels was approximately 14.8 percent. The low efficiency of energy transfer between trophic levels is usually the major factor that limits the length of food chains observed in a food web. The fact is, after four to six energy transfers, there is not enough energy left to support another trophic level. In the Lake Ontario example shown in [link] , only three energy transfers occurred between the primary producer, (green algae), and the apex consumer (Chinook salmon).
Notification Switch
Would you like to follow the 'Bi 101 for lbcc ilearn campus' conversation and receive update notifications?

|
|

|
|

|
|

|
|

|
|

|
|

|
|

|
|

|
|

|